
 Facebook
 Twitter
 Pinterest
 Copy Link
You can download the 4-page PDF here: Gardner Report PDF Download
|
|||||||||||||||||||
|
|||||||||||||||||||
|
|||||||||||||||||||
|
|||||||||||||||||||
|


Investing in a home is a great way to build passive income but earning from your investment will take a little groundwork to become a well-oiled machine. This is your beginner’s guide to owning an investment property so you can set up that foundation properly to avoid future headaches.
Make sure it’s livable
It’s important to start with your home inspection before you start making plans. Use the inspection report to prioritize the maintenance issues.
Before a tenant moves in, make sure the home is livable. Handle the important items that affect the livability of the property, either now or in the near future. If the inspector noticed a leak in the roof or holes that could lead to infestation, take care of those first. Other maintenance issues to prioritize are the fuel and the hot water source.
If your city has inspection and registration requirements, be sure to cross check those inspection checklists with your current property. If the property wouldn’t pass now, make sure it will pass by the time the city sees it.
Upgrade the space
Once your property is in livable condition, it’s time to upgrade. If you have any left-over budget after the necessities are handled, consider adding a bedroom or a bathroom where you can find the space. These rooms heavily impact the rental price, and the more you have the higher the price. If there’s no space for another bed or bath, think about finishing the basement or upgrading some of the appliances to make the property more attractive to potential tenants.
Use similar properties in your neighborhood as your inspiration. These units are your competition, think about what you can add, or even take away, that would help you compete. Ask yourself what about your home is unique and in what ways does that affect your rentability? If every unit in your area has hardwoods, how can you make your carpeted home appealing? Maybe new carpet? Or is switching to hardwoods, or vinyl laminate that looks like wood, worth it?
Market it to future tenants
You need two things in your listing: 1) Great Photos 2) An Amazing Description
After you’ve perfected the property, it’s time to tell potential tenants that it’s available. Creating the listing is essential in drawing eyes on the unit so you can show it to as many people as possible.
Renters looking to move are quick to make their first impression of a property with thumbnail photos on a map. So, take lots of great, bright, photos of the entire place to showcase the amenities and show potential tenants what it looks like, then choose the best photo to be the first in the lineup. Remember to get the lighting is just right to show every corner of the listing. Dark photos scare tenants away, making them think the unit is dingy and dirty. Light and bright photos show a clean home that’s move-in ready. They can imagine themselves living there a lot easier than in dark and cramped looking units.
Next, they’ll read the description. This is again where other listings in your area can help you.
Read other listings to structure your description and to draw inspiration on what tenants might think is important. Find the selling points and emphasize those above the unique features, especially if those unique features are obvious in the photos.

Anyone who has more than one child is frequently amazed by the difference between the children. How is it that two kids from the same parents are so different from each other?
Same goes in our Northern Colorado market. We see a major difference between certain price ranges and certain locations right here in our little neck of the woods.
Clients are constantly reading about and hearing about the “hot” market. They make assumptions that every price range and every location in Larimer and Weld Counties are on fire. Not true!
Just like two kids from the same parents are different, two price ranges in the same place are very different.
To make this point, let’s look at months of inventory. This statistic simply measures how long it would take to sell the current inventory of homes at the current pace of sales.
Across all price ranges, months of inventory in Larimer County = 2.0. Meaning it would take two months to sell all the homes currently for sale. But this is misleading, because months of inventory…
So, the $1,000,000 seller who hears that the market is “hot” is actually faced with a year’s inventory currently on the market!
This is a very high-level look at the differences in our market. I am happy to give you a detailed look at your exact neighborhood in your exact price range. Let us know if we can help!

You can download the 4-page PDF here: Gardner Report PDF Download
|
|||||||||||||||||||
|
|||||||||||||||||||
|
|||||||||||||||||||
|
|||||||||||||||||||
|

An article in last week’s Denver Post about the Metro Denver market cooling off has prompted questions from our clients.
Is the same thing happening in Northern Colorado?
Are the Larimer and Weld County markets showing signs of slowing?
Here’s the deal…
The Denver Post article points to the difference in number of transactions between June and July of this year. It’s no surprise to us that July had fewer closings.
What’s true in Metro Denver is also true in Northern Colorado – June tends to have more closings than any other month during the year so of course July will be slower.
What we do notice when we look at the numbers is that the difference between June and July is significant.
In all major markets in Northern Colorado, the difference between June and July is the greatest it has ever been in the last four years.
For example, in Fort Collins, July had 18% fewer closings than June. Whereas last year the difference was 9%. In Greeley the difference this year was 16% while last year was only 5%.
A month over month difference does not necessarily indicate a long-term trend. However, there is a difference compared to last year which should be welcome news to buyers who have been waiting for a slow down.
We have just completed a comprehensive report for anyone thinking about selling their home.
The Insider’s Guide to Selling Your Home (without any stress or surprises) is now available for you.
It is hot off the press and you can request a copy by emailing rdupont@windermere.com
Contact me to get your copy immediately so you can see everything you need to know to sell your home in today’s market.

What if we told you that market was right in our back yard?
The market is Wellington and what is happening there is extraordinary.
Because price increases in Fort Collins have eliminated virtually all options for the sub $300,000 buyer, Wellington has become a very popular place to buy a home.
In June of 2012, the average price there was $185,000. Today it is $300,500!
In 2012 there were 222 residential sales in Wellington. This year is on pace to ecliplse 500.
Yes, Wellington has exploded and we don’t see it slowing down any time soon!

The national homeownership rate is a very interesting statistic to track. It is simply the percentage of households in the country which are owned by the occupant (versus rented).
So what does this mean for real estate?
Some perspective is in order…
First, mortgage rates are not directly tied to the Fed Funds rate. They are, however, closely tied to the 10-year Treasury.
While the Fed was raising their rates this week, mortgage rates actually dipped lower (although slightly).
Mortgage rates today on a 30-year loan are essentially 4.25%.
The long term average for mortage rates, going all the way back to 1970 is 7.5%
For every 1% rise in rates, there is a corresponding 10% impact to the monthly payment.
Mortgage rates have increased about 0.75% since the election.
Most economists expect rates to increase another 0.5% by year-end.
I am watching mortgage rates closely and will continue to keep my customers updated as to where the experts think they are heading.

Another source just confirmed this.
The Federal Housing Finance Authority recently released their quarterly report on 260 metropolitan markets across the country.
Get this, Colorado has 4 cities ranked in the top 15 for yearly price growth.
Northern Colorado is well-represented on this list.
By the way, Denver is 14th. And in case you are wondering, Palm Bay Florida is ranked 1st.
All of the Northern Colorado cities have had just over 10% appreciation in the last year meaning that prices are growing at about double the long-term average.
To receive a copy of the full FHFA report, simply email me at rdupont@windermere.com and I will get one in your hands right away.
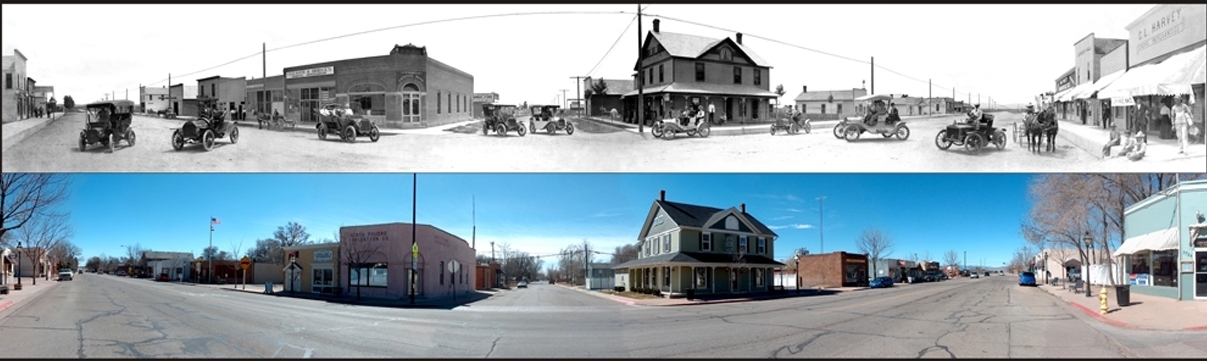
As you drive through Estes you may wonder "how's the mountain market?"
Here are some fun facts about real estate in Estes Park.
Now you know about the Mountain Market!
 Buyers who were frustrated during the first half of the year with low inventory and bidding wars now realize a better environment. It's time to step off the sidelines and take a fresh look at what the market has to offer.
The first piece of good news is that rates have dropped to near all-time lows. Rates today are 0.6% lower than they were on January 1st. What this means on a $400,000 home with a conventional loan is a monthly savings of $110!
The second piece of good news is that inventory levels are coming up. There are more homes on the market to pick from and lower demand because of seasonal slowing. Months of inventory in Larimer County markets have bounced up 20% to 33%.


