
 Facebook
 Twitter
 Pinterest
 Copy Link
Vegas Baby


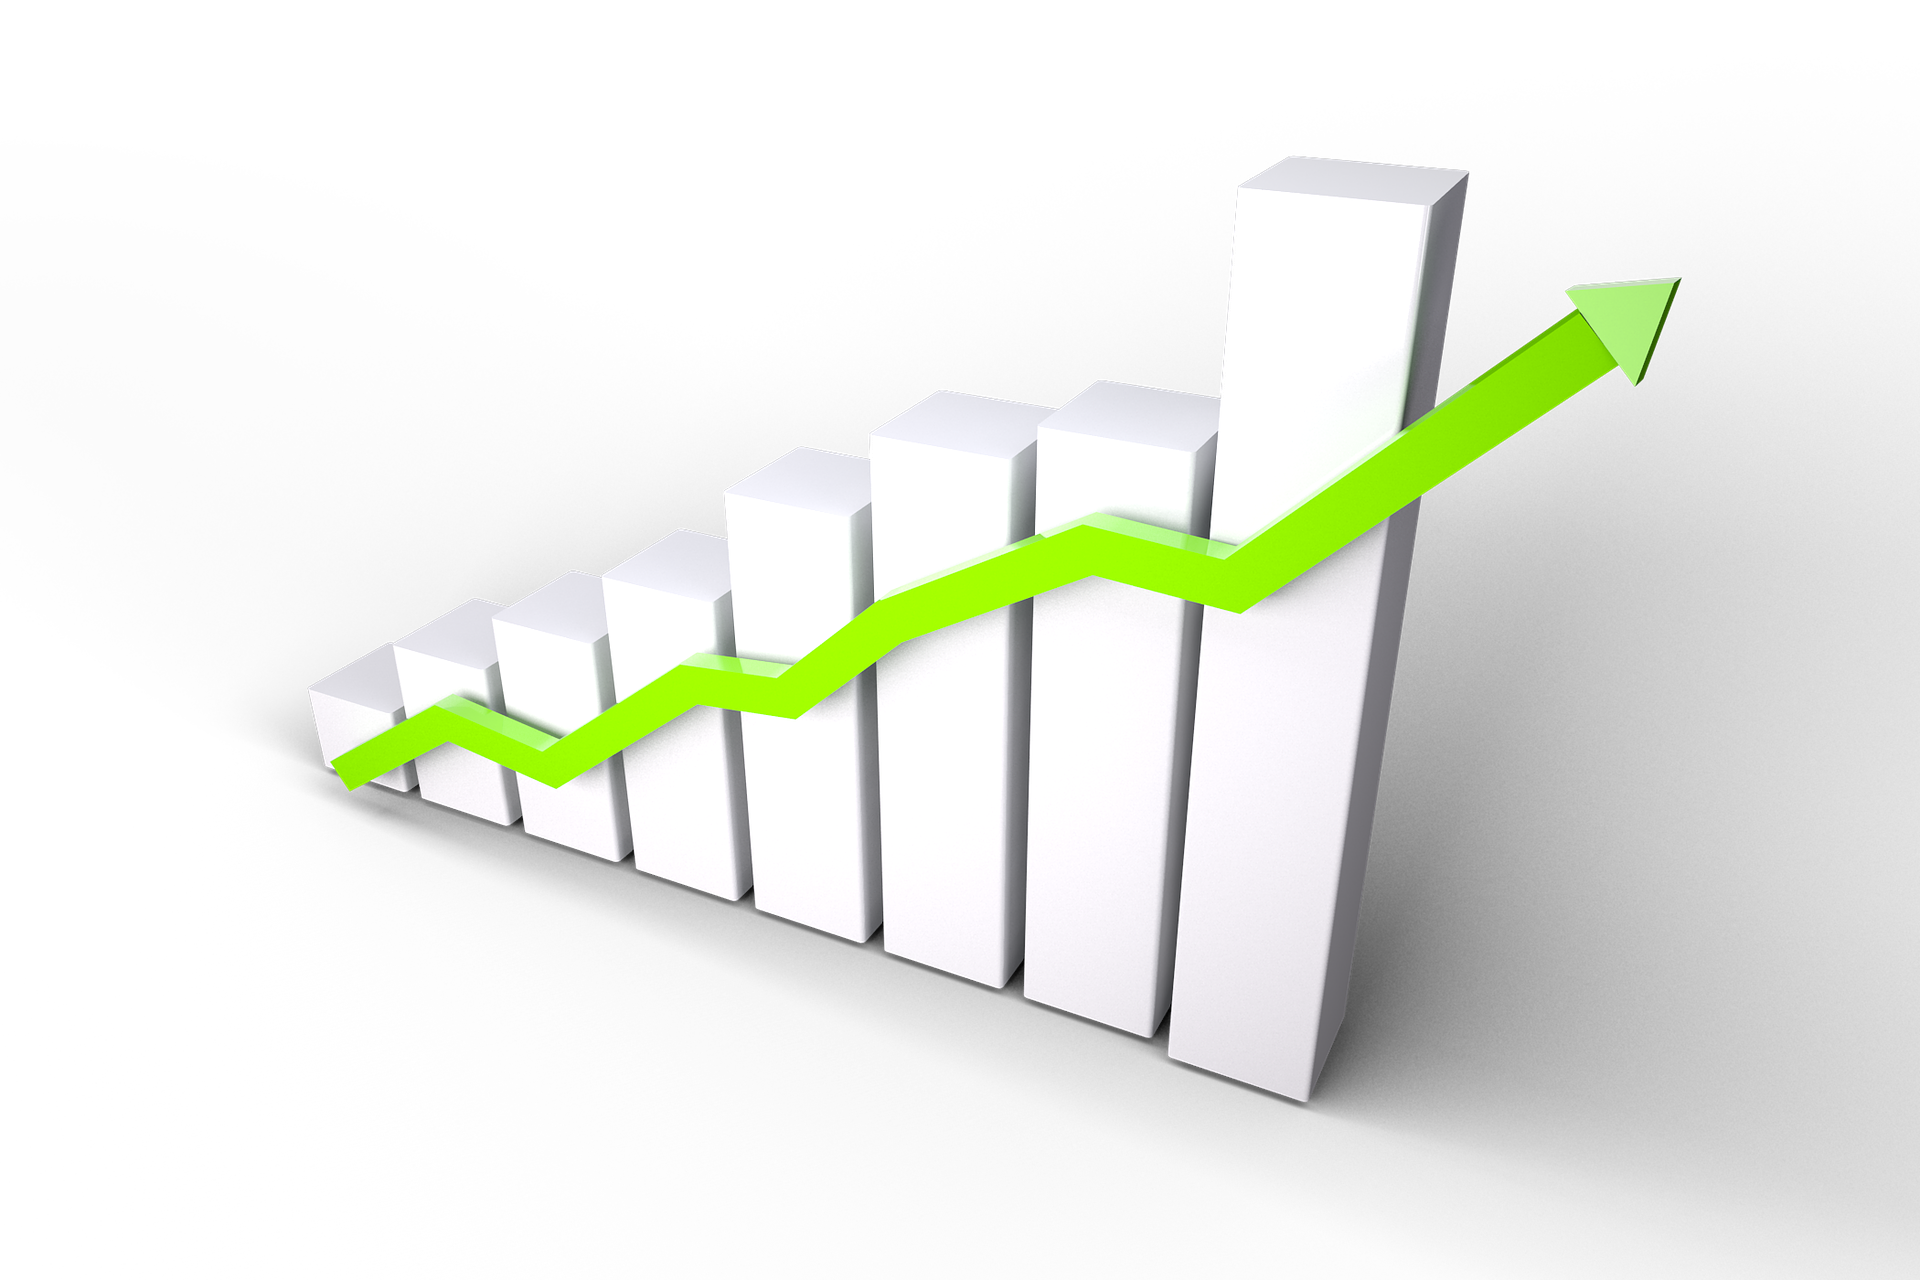
The results are in from FHFA.gov’s latest ranking of the top performing markets in the U.S.
Each quarter they track 245 cities across the country and rank their real estate markets by home price appreciation.
What’s the highest performing city the the U.S.
Vegas! Their prices have gone up 17.63% in the last year.
How about the worst?
Bloomington, Illinois sits in dead last where prices went down 3.58%
Here’s how Colorado cities are ranked:
• #10 Colo. Springs = 11.41%
• #16 Greeley = 10.68%
• #59 Fort Collins = 8.29%
• #64 Denver = 8.15%
• #97 Boulder = 6.85%
OUR FORECAST
This past Wednesday and Thursday evenings we had the pleasure of hosting our annual Market Forecast events in Denver and Fort Collins.
Thank you to the 700 people who attended both events. We appreciate your support!
In case you missed the events, here are some highlights including our forecast for price appreciation in 2019:
• In 2018 Prices went up:
o 8% in Fort Collins
o 8% in Loveland
o 8.5% in Greeley
o 8% in Metro Denver
• Inventory is (finally) showing signs of increasing:
o Up 25% in Northern Colorado
o Up 45% in Metro Denver
• There are distinct differences in months of inventory across different price ranges = opportunity for the move up buyer.
• There are several reasons why we don’t see a housing bubble forming:
o New home starts along the Front Range are roughly 60% of pre-bubble highs 14 years ago.
o Americans have more equity in their homes than ever, $6 Trillion!
o The average FICO score of home buyers is significantly higher than the long-term average.
o The home ownership rate is back to the long-term average.
• Our 2019 Price Appreciation Forecast:
o 6% in Fort Collins
o 6% in Loveland
o 7% in Greeley
o 6% in Metro Denver
If you would like a copy of the presentation, go ahead and reach out to me. I would be happy to put it in your hands!
A History Lesson

One of the most common questions we hear from clients is “Where do you think interest rates are going?”
Virtually all of the experts we follow put rates above 5% going into next year and some see rates approaching 5.5% by the middle of 2019. What’s certain is that there are economic forces at work that are pushing rates higher.
So, how about a little history lesson? How do today’s 30- year mortgage rates compare to this same date in history going all the way back to 1990?
• Today = 4.85%
• 2017 = 3.94%
• 2015 = 3.82%
• 2010 = 4.27%
• 2005 = 5.98%
• 2000 = 7.84%
• 1995 = 7.75%
• 1990 = 10.22%
While today’s rates feel high only because they are higher than 2017, they are quite a bit lower than at many times in history.
The Cost of Waiting

It’s true, certain parts of our market are cooling off. We are seeing fewer multiple offers, fewer bidding wars, and fewer inspection concessions.
However, homes that are priced right and in great condition are selling, and in many cases, selling quickly.
As buyers feel the market cool a bit, it may cause them to want to wait. They sometimes feel like it’s a better choice to ‘wait and see what happens.’
The reality is, there is a real cost to waiting given two specific facts.
1. Interest rates will continue to rise
2. Prices will continue to rise
Interest rates are a little more than 0.5% higher than a year ago and experts predict them to be another 0.5% higher by this time next year.
Prices have been appreciating at roughly 10% per year for the last four years. Based on the numbers, we see that appreciation could be 5% per year for the next two years.
So, let’s look at a house priced at $450,000 today. If prices go up “only” 5% for the next 12 months, that home will cost $22,500 more in a year.
And, if rates go up another half percent, the monthly payment will be $206 higher. That’s an 11% increase!
In an environment of rising prices and rising rates, there is a real cost to “wait and see.”
Average Home Prices in Northern Colorado

Yesterday the Coloradoan ran a very good article about the increase of average home prices in Larimer County, which they stated has now reached $405,000.
We thought this article may make you curious to know what the average prices are in each specific city in Northern Colorado:
- Fort Collins = $453,051
- Loveland = $402,132
- Windsor = $463,769
- Greeley = $310,785
- Timnath = $604,481
- Wellington = $338,999
- Boulder = $1,105,634
source = IRES
Contact me today to find out what your home would be valued at in today’s market!
April Showers

The April results are in for Larimer and Weld County…
To see an update as to what is happening in the Northern Colorado market, contact me to receive our quarterly “Scoop” report.
Bubbly?
Because our Northern Colorado market has been so active over the last four years, clients often ask us if we think there is a housing bubble forming.
There are several key statistics which we track closely in order to answer that question.
Here is one fact that we find to be insightful…
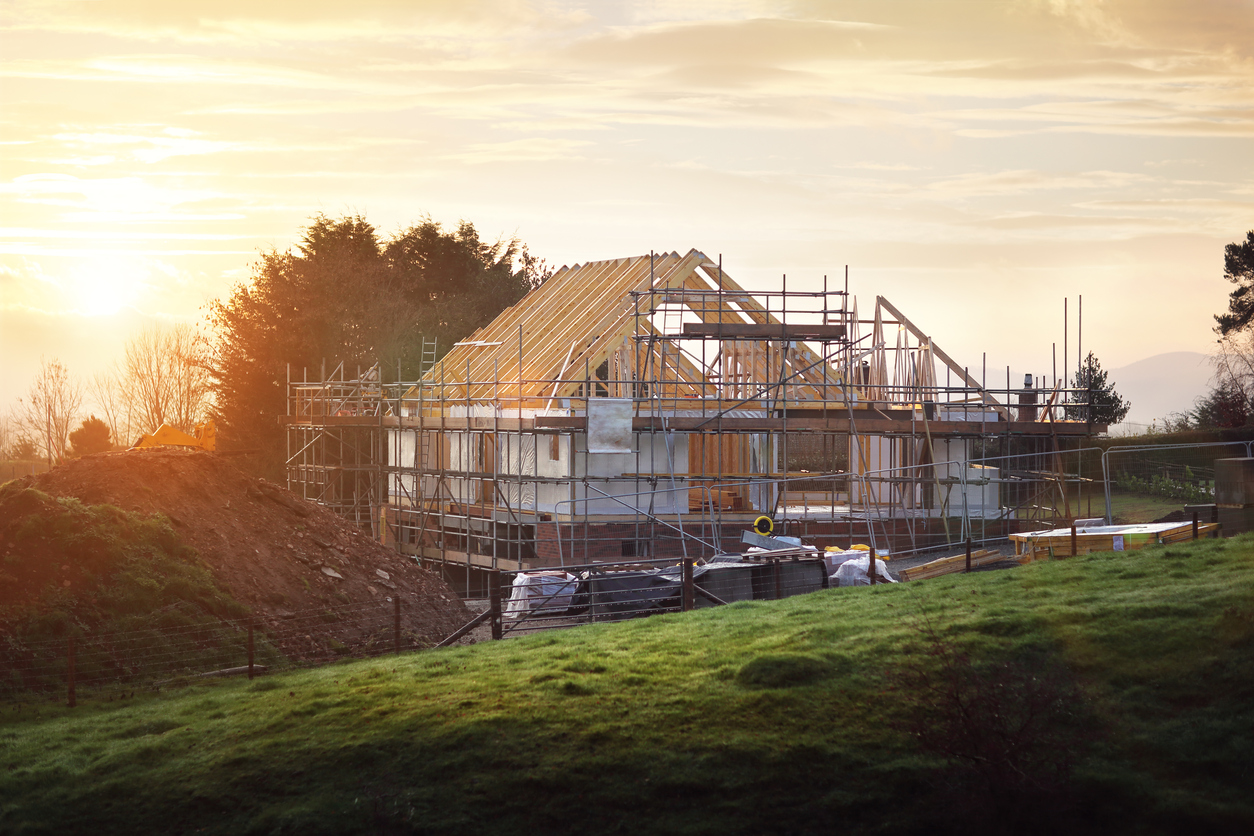
One of the root causes of the last housing bubble was the glut of inventory, and specifically new home inventory. Quite simply, the market was being oversupplied with new homes. The rules of economics say when there is oversupply, prices must come down.

Today, there are far fewer new home starts compared to 2004 and 2005 when the last bubble was forming – despite there being a larger population.
According to our friends at Metrostudy who track the new home market, Northern Colorado has had 4,452 new home starts in the last 12 months.
That number is only 60% of what it was at the height of construction in early 2005.
It is also interesting to note that over the last 12 months there have been 4,473 new home closings which shows that demand is keeping up with supply.
So when you drive around Northern Colorado and notice all the new homes being built, know that construction activity is far less than what is was during the bubble and that demand is keeping up with supply.
In case you missed our annual real estate Forecast event, you can reach out to me to see the presentation slides or receive a video recap of the information. Just email me at rdupont@windermere.com
Get Real

A story ran this week which highlighted the number of people who have moved out of Colorado.
Let’s get real, there are still a large number of people moving to Colorado.

In fact, 223,000 moved to Colorado from another state last year according to the latest American Community Survey from the U.S. Census Bureau.
The net migration into our state (after subtracting out people who left) was 30,859 people.
In Northern Colorado the net migration looks like this:
- Larimer County = 7,001 people
- Weld County = 7,117 people
So what does that mean for housing? Knowing that, on average, 2.5 people live in each household, the number of new housing units required for these new residents looks like this:
- Larimer County = 2,800 new housing units
- Weld County = 2,847 new housing units
Greeley’s Major Milestone

The Greeley market is about to hit a major milestone.
 Today the average price sits at $289,870.
Colorado Home Price Appreciation

New Rankings
The new rankings are out from the Federal Housing Finance Authority which ranks all 50 states plus  close to 300 individual metropolitan markets for home price appreciation.
Check out the FHFA recap video here:
Here is the data straight from FHFA’s report:
U.S. house prices rose 1.6 percent in the second quarter of 2017 according to the Federal Housing Finance Agency (FHFA) House Price Index (HPI). House prices rose 6.6 percent from the second quarter of 2016 to the second quarter of 2017. FHFA’s seasonally adjusted monthly index for June was up 0.1 percent from May.
The HPI is calculated using home sales price information from mortgages sold to, or guaranteed by, Fannie Mae and Freddie Mac. FHFA has produced a video of highlights for this quarter.
Significant Findings
- Home prices rose in 48 states and the District of Columbia between the second quarter of 2016 and the second quarter of 2017. The top five states in annual appreciation were: 1) Washington 12.4 percent; 2) Colorado 10.4 percent; 3) Idaho 10.3 percent; 4) Florida 9.4 percent; and 5) Utah 9.2 percent.
- Among the 100 largest metropolitan areas in the U.S., annual price increases were greatest in the Seattle-Bellevue-Everett, WA (MSAD), where prices increased by 15.7 percent. Prices were weakest in New Haven-Milford, CT, where they rose by 0.1 percent.
- Of the nine census divisions, the Pacific division experienced the strongest increase in the second quarter, posting a 2.6 percent quarterly increase and a 8.9 percent increase since the second quarter of last year. House price appreciation was weakest in the Middle Atlantic division, where prices rose 0.8 percent from the last quarter.
Source: FHFA
