
 Facebook
 Twitter
 Pinterest
 Copy Link
Average Home Prices in Northern Colorado

Yesterday the Coloradoan ran a very good article about the increase of average home prices in Larimer County, which they stated has now reached $405,000.
We thought this article may make you curious to know what the average prices are in each specific city in Northern Colorado:
- Fort Collins = $453,051
- Loveland = $402,132
- Windsor = $463,769
- Greeley = $310,785
- Timnath = $604,481
- Wellington = $338,999
- Boulder = $1,105,634
source = IRES
Contact me today to find out what your home would be valued at in today’s market!
Double Up

Fort Collins, over the last 12 months, has seen sales of homes priced $1,000,000 and over almost double.
There have been 47 sales of these luxury properties during the last year compared to 24 sales the year before that.
The current pace of roughly 4 of these properties selling per month is both unprecedented and very different compared to the other Northern Colorado markets.
Loveland, Greeley and Windsor have only seen very slight increases in sales of homes priced over $1,000,000.
So where are these homes selling in Fort Collins? These are the top neighborhoods for luxury sales:
- Fossil Lake Ranch
- Old Town
- The Hill at Cobb Lake
- Linden Lake
Top 5
Greeley is the 5th-ranked city in the whole country for one year appreciation. This is according to the Federal Housing Finance Authority’s most recent quarterly report. They track close to 300 markets all over the U.S.
For the first time in a long time, the Fort Collins/Loveland market did not make the top 20 list- they came in ranked 76th.
Greeley’s appreciation over the last year was 12.63% and Fort Collins/Loveland’s was 7.98%.
Who was first? Boise, Idaho with 15.25%.
Who was last? Peoria, Illinois whose prices fell 1.26%.
What about other Colorado cities?
- Colorado Springs – 14th @ 11.65%
- Grand Junction – 16th @ 11.47%
- Denver – 28th @ 10.18%
- Boulder – 68th @ 8.25%
Overall, prices in the U.S. increased by an average of 6.9%. A couple of interesting side notes- a minimum of 11% was required to make the top-20, and 18 of the top 20 are in the Western U.S.
Grab a copy of our Investment Kit so you can see the simple steps to get started without stress or complication. Email us at rdupont@windermere.com and I will send you a video which clarifies the process and our Investment Checklist so you can see what to do first.
66% Off

This just in…
For the month of April, the average price of a home in the city of Boulder was $1,247,000. This is according to the latest from our IRES MLS system. 
If you want to own a home about an hour down the road in another really nice college town and get a 66% discount, you may want to check out Fort Collins 🙂
Yes, despite the recent uptick in prices here locally, we are still a bargain compared to Boulder. Here are median single-family prices for our markets and their relative price to Boulder:
- Fort Collins = $414,237 (66.8% off)
- Loveland = $360,150 (71.1% off)
- Greeley = $290,000 (76.7% off)
- Windsor = $306,450 (75.4% off)
Grab a copy of our Investment Kit so you can see the simple steps to get started without stress or complication. Email us at rdupont@windermere.com and I will send you a video which clarifies the process and our Investment Checklist so you can see what to do first.
April Showers

The April results are in for Larimer and Weld County…
To see an update as to what is happening in the Northern Colorado market, contact me to receive our quarterly “Scoop” report.
The Gardner Report
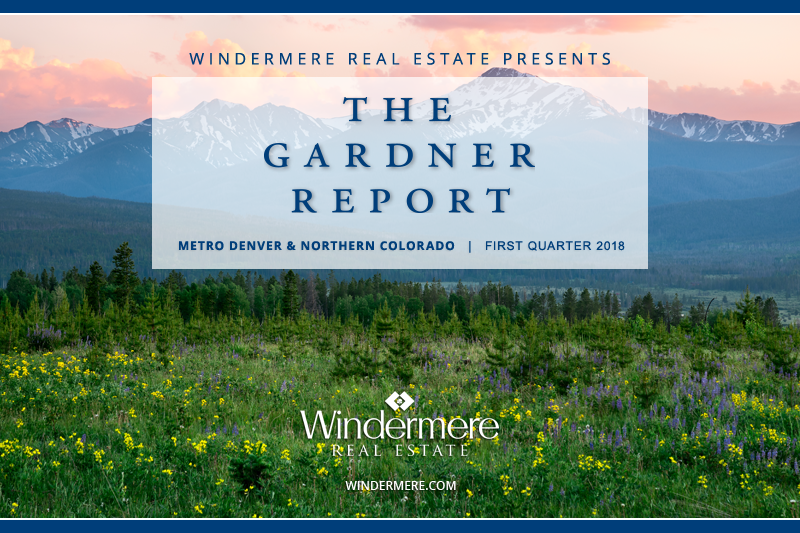

The following analysis of the Metro Denver & Northern Colorado real estate market is provided by Windermere Real Estate Chief Economist Matthew Gardner. We hope that this information may assist you with making better-informed real estate decisions. For further information about the housing market in your area, please don’t hesitate to contact me.
ECONOMIC OVERVIEW
It’s good news for the state of Colorado, which saw annual employment grow in all of the metropolitan markets included in this report. The state added 63,400 non-agricultural jobs over the past 12 months, an impressive growth rate of 2.4%. Colorado has been adding an average of 5,300 new jobs per month for the past year, and I anticipate that this growth rate will continue through the balance of 2018.
In February, the unemployment rate in Colorado was 3.0%—a level that has held steady for the past six months. Unemployment has dropped in all the markets contained in this report, with the lowest reported rates in Fort Collins and Denver, where 3.1% of the labor force was actively looking for work. The highest unemployment rate was in Grand Junction, which came in at 4.6%.
HOME SALES ACTIVITY
- In the first quarter of 2018, there were 11,173 home sales—a drop of 5.6% when compared to the first quarter of 2017.
- With an increase of 5.3%, home sales rose the fastest in Boulder County, as compared to first quarter of last year. There was also a modest sales increase of 1.2% in Larimer County. Sales fell in all the other counties contained within this report.
- Home sales continue to slow due to low inventory levels, which were down 5.7% compared to a year ago.
- The takeaway here is that sales growth continues to stagnate due to the lack of homes for sale.

HOME PRICES
 Strong economic growth, combined with limited inventory, continued to push prices higher. The average home price in the markets covered by this report was up by 11.7% year-over-year to $448,687.
- Arapahoe County saw slower appreciation in home values, but the trend is still positiveand above its long-term average.
- Appreciation was strongest in Boulder County, which saw prices rise 14.8%. Almost all other counties in this report experienced solid gains.
- The ongoing imbalance between supply and demand persists and home prices continue to appreciate at above-average rates.

DAYS ON MARKET
- The average number of days it took to sell a home dropped by three days when compared to the first quarter of 2017.
- Homes in all but two counties contained in this report took less than a month to sell. Adams County continues to stand out where it took an average of just 17 days to sell a home.
- During the first quarter, it took an average of 27 days to sell a home. That rate is down 2 days from the fourth quarter of 2017.
- Housing demand remains strong and would-be buyers should expect to see stiff competition for well-positioned, well-priced homes.

CONCLUSIONS

This speedometer reflects the state of the region’s housing market using housing inventory, price gains, home sales, interest rates, and larger economic factors. In the first quarter of 2018, I have left the needle where it was in the fourth quarter of last year. Even as interest rates trend higher, it appears as if demand will continue to outweigh supply. As we head into the spring months, I had hoped to see an increase in the number of homes for sale, but so far that has not happened. As a result, the housing market continues to heavily favor sellers.

Matthew Gardner is the Chief Economist for Windermere Real Estate, specializing in residential market analysis, commercial/industrial market analysis, financial analysis, and land use and regional economics. He is the former Principal of Gardner Economics, and has more than 30 years of professional experience both in the U.S. and U.K.
Under $300,000

If a real estate buyer walks into one of our offices in Northern Colorado and tells us they are looking for a single-family home under $300,000, unfortunately there will not be many properties to choose from. Depending on where they are looking the choices may be very limited.
Here is a list of the number of single-family homes currently for sale (excluding manufactured homes) in Northern Colorado:
- Fort Collins = 0
- Loveland = 7
- Windsor = 0
- Wellington = 0
- Timnath = 0
- Greeley = 27
- Evans = 8
- Milliken = 2
If our active market has you thinking about investing in real estate in Northern Colorado. Check this out…
Grab a copy of our Investment Kit so you can see the simple steps to get started without stress or complication. Email me at rdupont@windermere.com and I will send you a video which clarifies the process and our Investment Checklist so you can see what to do first.
Foreclosed

Remember when the hot topics in real estate were short sales and foreclosures? Not today!
As an additional indicator of the health of our market, foreclosure activity is significantly lower than it was 7 to 8 years ago.
Today in Colorado only 1 in 3920 homes is in foreclosure. This is much lower than the current national number of 1 in every 2043 homes.
How about Northern Colorado? Both Larimer and Weld Counties are performing better than the National Average.
In Larimer County the number is 1 in 6695 and Weld County is 1 in 2849.
Colorado Real Estate Market Update

This analysis of the Metro Denver and Northern Colorado real estate markets is provided by Windermere Real Estate Chief Economist Matthew Gardner. We hope that this information may assist you with making better-informed real estate decisions. For further information about the housing market in your area, please don’t hesitate to contact us.

ECONOMIC OVERVIEW
Colorado added 45,300 non-agricultural jobs over the past 12 months, a growth rate of 1.7%. Although that is a respectable number, employment growth has been trending lower in 2017 as the state reaches full employment. Within the metropolitan market areas included in this report, there was annual employment growth in all areas other than Grand Junction, where employment was modestly lower. There was solid growth in Greeley and Fort Collins, where annual job growth was measured at 4% and 2.7%, respectively.
In November, the unemployment rate in the state was a remarkably low 2.9%, down from 3% a year ago. The lowest reported unemployment rates were seen in Fort Collins and Boulder, where only 2.5% of the labor force was actively looking for work. The highest unemployment rate (3.7%) was in Grand Junction.
The state economy has been performing very well, which is why the wage growth over the past year has averaged a very solid 3.3%. I expect the labor market to remain tight and this will lead to wages rising at above-average rates through 2018.
HOME SALES ACTIVITY
- In the fourth quarter of 2017, there were 14,534 home sales—a drop of 2.0% compared to a year ago.
- Sales again rose the fastest in Boulder County, which saw sales grow 17.9% versus the third quarter of 2016. There were also reasonable increases in Weld and Larimer Counties. Sales fell in all other counties contained within this report because there is such a shortage of available homes for sale.
- As I discussed in my third quarter report, sales slowed due to the lack of homes for sale. The average number of homes for sale in the markets in this report is down by 8.2% from the fourth quarter of 2016.
- The takeaway is that sales growth has moderated due to the lack of homes for sale.

HOME PRICES

- With continued competition for the limited number of available homes, prices continued their upward trend. Average prices were up 9.8% year-over-year to a regional average of $431,403, which was slightly higher than the third quarter of 2017.
- There was slower appreciation in home values in Boulder County, but the trend is still positive.
- Appreciation was strongest in Weld County, which saw prices rise 14.3%. There were also solid gains in almost all other counties considered in this report.
- The ongoing imbalance between supply and demand persists, which means we can expect home prices to continue appreciating at above-average rates for the foreseeable future.

DAYS ON MARKET
- The average number of days it took to sell a home rose by two days when compared to the fourth quarter of 2016.
- Homes in all but three counties contained in this report took less than a month to sell. Adams County continues to stand out, where it took an average of just 21 days for homes to sell.
- It took an average of 29 days to sell a home last quarter. This is up nine days over the third quarter of 2017.
- Housing demand remains strong in Colorado and this will continue with well-positioned, well-priced homes continuing to sell very quickly.

CONCLUSIONS

This speedometer reflects the state of the region’s housing market using housing inventory, price gains, home sales, interest rates, and larger economic factors.
For the fourth quarter of 2017, I have chosen to leave the needle where it was in the previous quarter. Listings remain scarce, but this did not deter buyers who are still active in the market. As much as I want to see more balance between supply and demand, I believe the market will remain supply-constrained as we move toward the spring, which will continue to heavily favor sellers.

Matthew Gardner is the Chief Economist for Windermere Real Estate, specializing in residential market analysis, commercial/industrial market analysis, financial analysis, and land use and regional economics. He is the former Principal of Gardner Economics, and has more than 30 years of professional experience both in the U.S. and U.K.
Bubbly?
Because our Northern Colorado market has been so active over the last four years, clients often ask us if we think there is a housing bubble forming.
There are several key statistics which we track closely in order to answer that question.
Here is one fact that we find to be insightful…
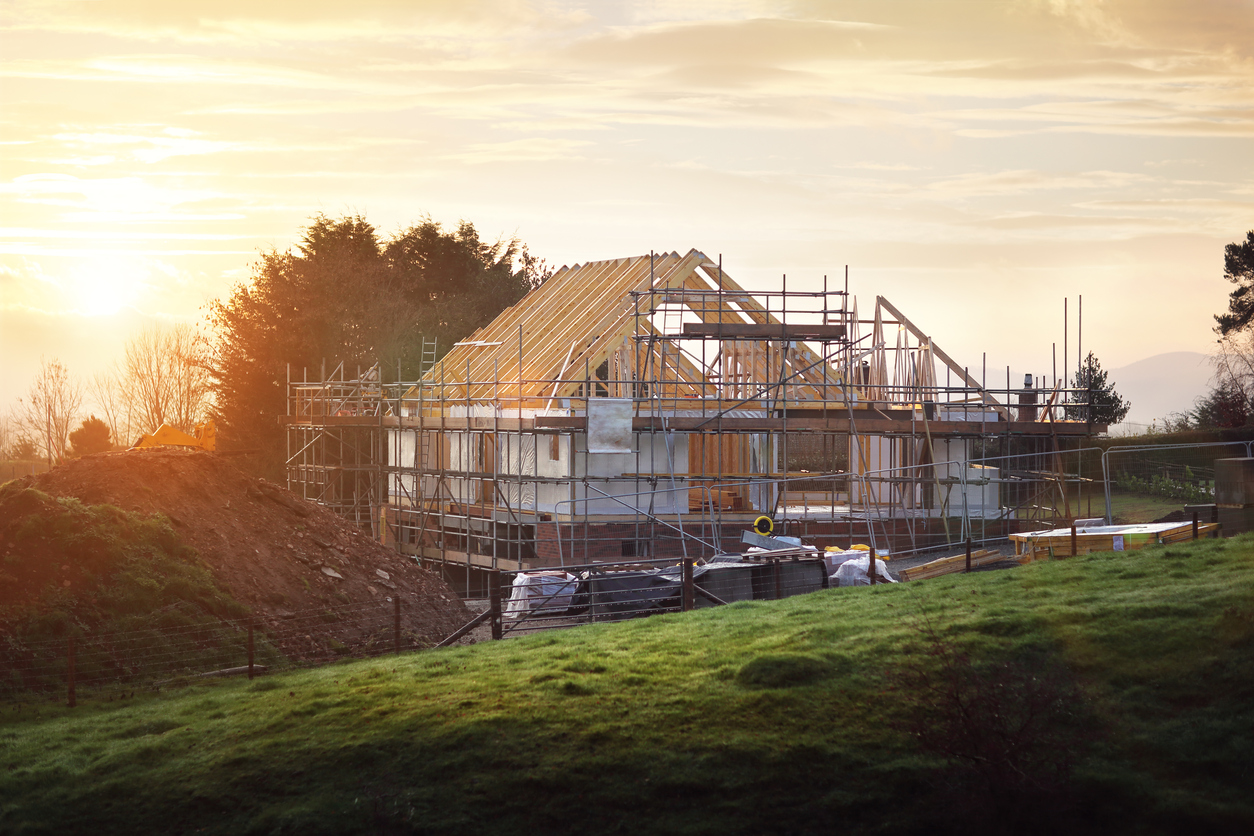
One of the root causes of the last housing bubble was the glut of inventory, and specifically new home inventory. Quite simply, the market was being oversupplied with new homes. The rules of economics say when there is oversupply, prices must come down.

Today, there are far fewer new home starts compared to 2004 and 2005 when the last bubble was forming – despite there being a larger population.
According to our friends at Metrostudy who track the new home market, Northern Colorado has had 4,452 new home starts in the last 12 months.
That number is only 60% of what it was at the height of construction in early 2005.
It is also interesting to note that over the last 12 months there have been 4,473 new home closings which shows that demand is keeping up with supply.
So when you drive around Northern Colorado and notice all the new homes being built, know that construction activity is far less than what is was during the bubble and that demand is keeping up with supply.
In case you missed our annual real estate Forecast event, you can reach out to me to see the presentation slides or receive a video recap of the information. Just email me at rdupont@windermere.com
