BlogFun Facts July 8, 2022

Top Three


Here are the top three reasons why prices are unlikely to crash even though the market has cooled off:

  1. Inventory – Ultimately, prices are driven by supply and demand.  Although supply has increased, it still remains relatively low with less than two months’ supply in most areas.
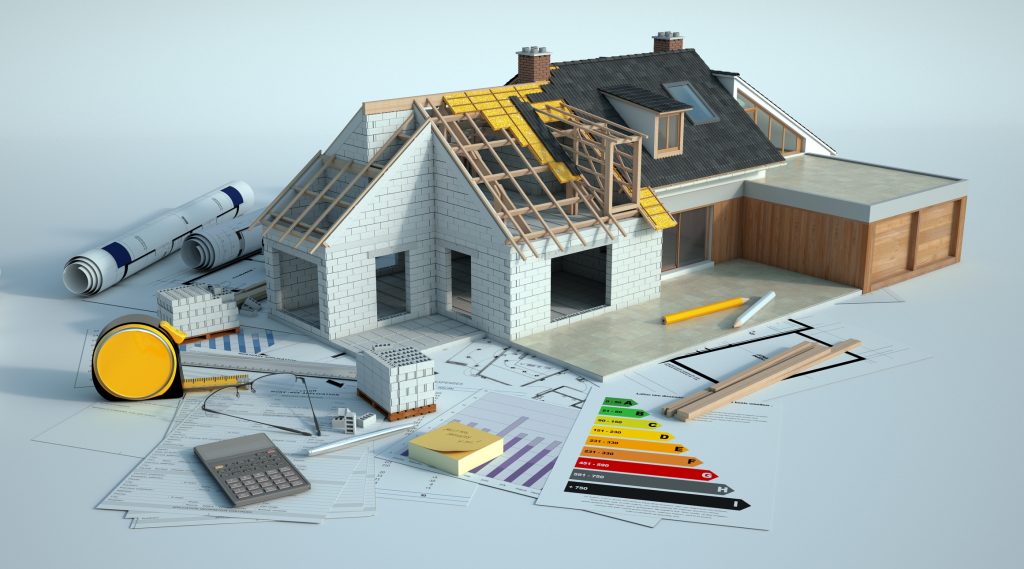
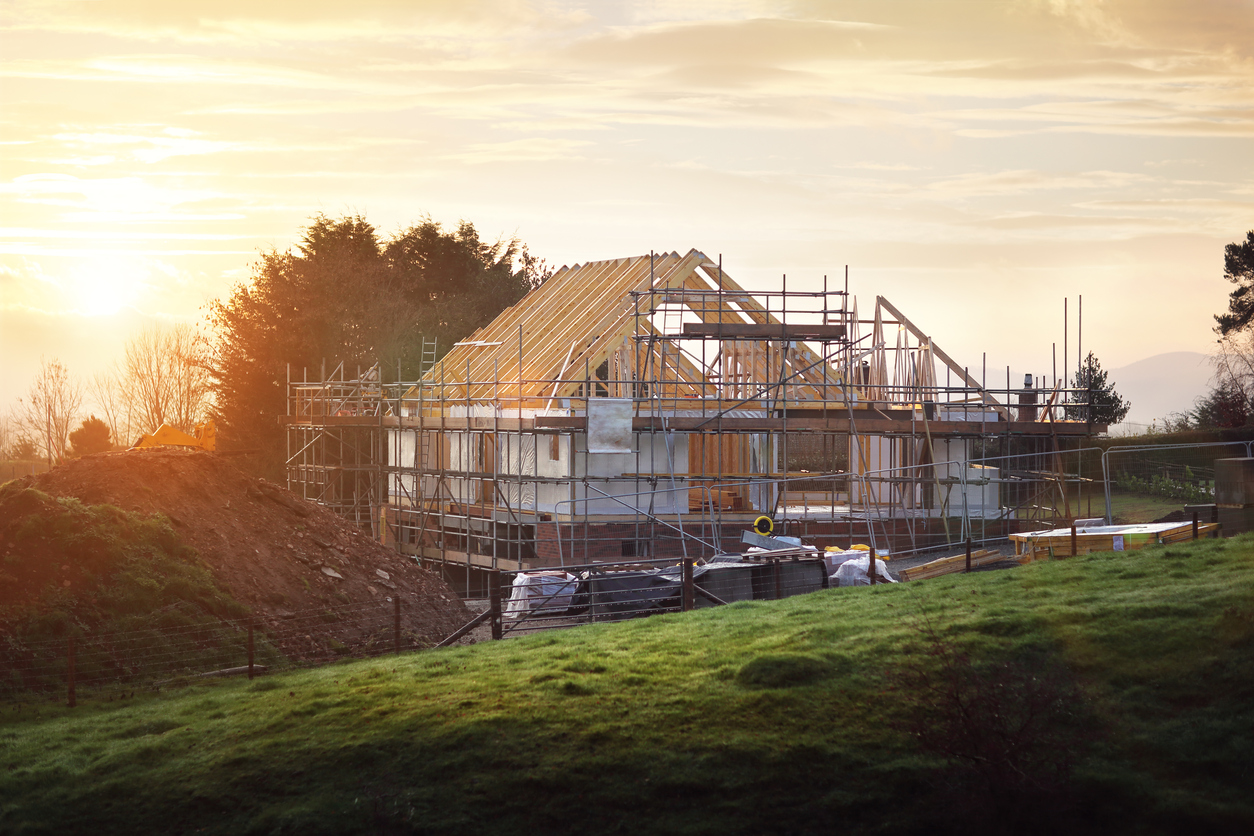
  2. New Homes – New home construction still lags behind the demand stemming from population growth.  New home starts today are roughly 2/3 of what they were in 2005.
  3. Credit – Home buyers today are highly qualified which protects the market from a glut of ‘distressed’ properties hitting the market in an economic downturn.  The average credit score of buyers is now 776 which, by definition, is ‘excellent.’   Only 2% of loans today are given to buyers with scores under 640 whereas in 2001 25% of buyers had that low of a score.
BlogFun Facts May 17, 2021

5.5 Million Short

New home construction is behind by 5.5 million homes over the last 14 years.

Since 2007, new home starts have lagged significantly behind the long-term average.

The Census Bureau started tracking National new home starts in 1958.

Between 1958 and 2007, an average of 1,102,938 new homes were started each year.

Between 2007 and 2020 the average fell to 708,186 which represents a shortfall of 394,752 per year.

That adds up to a total shortfall of 5,526,525.

The under-supply of new homes is of course a significant reason why the market is under-supplied overall.

credit Inman News as the source of this story

BlogFun Facts January 22, 2021

Bubble Talk

A hot topic of conversation these days is the prospect of another real estate bubble.  People wonder if prices can continue at their current pace and some fear a repeat of 2008.


Because we get asked about this topic so often from our clients, we thought it would make sense to ask our in-house expert, Matthew Gardner.


Matthew is our Chief Economist and was our Keynote Speaker at the Windermere Annual Market Forecast.


During the Forecast presentation, he discussed the bubble concerns and laid out his reasons why he sees no potential of prices bursting along the Front Range.


Quite the opposite actually, he sees that prices will continue to go up, but just not as fast as they have been.


His reasons for no bubble bursting are as follows:

  • Record-low inventory – prices cannot crash without a glut of supply on the market
  • Highly-qualified buyers – lending guidelines are more stringent today than they have been in our lifetime
  • Growing jobs – job growth in Colorado is projected to far outpace the national average this coming year

So, we project a healthy real estate market in 2021.

To see a replay of the Forecast presentation, simply reach out to us, we would be happy to send you the recording.


Fort Collins RealtorFun Facts October 21, 2018

A History Lesson

One of the most common questions we hear from clients is “Where do you think interest rates are going?”

Virtually all of the experts we follow put rates above 5% going into next year and some see rates approaching 5.5% by the middle of 2019. What’s certain is that there are economic forces at work that are pushing rates higher.

So, how about a little history lesson? How do today’s 30- year mortgage rates compare to this same date in history going all the way back to 1990?

• Today = 4.85%
• 2017 = 3.94%
• 2015 = 3.82%
• 2010 = 4.27%
• 2005 = 5.98%
• 2000 = 7.84%
• 1995 = 7.75%
• 1990 = 10.22%

While today’s rates feel high only because they are higher than 2017, they are quite a bit lower than at many times in history.

BlogFort Collins Real EstateFort Collins RealtorFun FactsNorthern Colorado Real Estate January 26, 2018

Bubbly?

Because our Northern Colorado market has been so active over the last four years, clients often ask us if we think there is a housing bubble forming.

There are several key statistics which we track closely in order to answer that question.

Here is one fact that we find to be insightful…

One of the root causes of the last housing bubble was the glut of inventory, and specifically new home inventory. Quite simply, the market was being oversupplied with new homes. The rules of economics say when there is oversupply, prices must come down.

Are we in a housing bubble?

Today, there are far fewer new home starts compared to 2004 and 2005 when the last bubble was forming – despite there being a larger population.
According to our friends at Metrostudy who track the new home market, Northern Colorado has had 4,452 new home starts in the last 12 months.

That number is only 60% of what it was at the height of construction in early 2005.

It is also interesting to note that over the last 12 months there have been 4,473 new home closings which shows that demand is keeping up with supply.

So when you drive around Northern Colorado and notice all the new homes being built, know that construction activity is far less than what is was during the bubble and that demand is keeping up with supply.

In case you missed our annual real estate Forecast event, you can reach out to me to see the presentation slides or receive a video recap of the information. Just email me at rdupont@windermere.com

BlogFort Collins Real EstateFort Collins RealtorFun Facts October 27, 2017

Short vs Long

There are short-term questions about real estate and there are long term questions about real estate.

Clients often have short-term questions like…

How much will prices go up next year? Should I sell my house this Fall or next Spring? Will interest rates go up next week?

We encourage our clients to evaluate those questions in the context of the long-term. There are decades of data on the Northern Colorado market which reveal certain patterns.

When we show our clients these patterns they feel confident and secure in the investment they have made into their home and their rental properties.

For example, the long-term appreciation rates based on up to 41 years of research are as follows:

  • Larimer County = 5.36%
  • Weld County = 4.25%
  • Metro Denver = 5.56%

So over the course of a year prices may go up a lot or go up a little, but in the long term they will stay true to these long term averages.

To see an update as to what is happening in the Northern Colorado market, contact me to receive our quarterly “Scoop” report.

BlogFort Collins Real EstateFort Collins RealtorFun Facts September 15, 2017

Greeley’s Major Milestone

The Greeley market is about to hit a major milestone.

We project that in the first quarter of 2018, the average price for a single family home in Greeley will surpass $300,000.

Today the average price sits at $289,870.

Just a year ago it was $262,828.

Guess when Greeley broke the $200,000 barrier? It was only about 3 years ago in June 2014.

So what ‘s going on?

Double-digit price appreciation is being fueled by a healthy Northern Colorado economy, low interest rates and local affordability. Greeley prices can look really attractive compared to Fort Collins.

We don’t see anything on the horizon that will significantly change the trajectory of the Greeley market. It is a fundamentally a very strong place to own real estate.

For a detailed look at what ‘s happening across Colorado, request our quarterly market report called “The Gardner Report“, written by Windermere Real Estate’s Chief Economist, Matthew Gardner.

BlogFort Collins Real EstateFort Collins RealtorFun Facts September 8, 2017

Fall vs Spring

A question we start to hear from clients this time of year is “am I better off waiting until the Spring to sell my home?”

The perception is that Spring is the busy time for home sales and that a Seller would be better served waiting to sell their home.

The reality is the numbers show that your odds of selling your home in the fall (and even the Winter) are just as good as the Spring. The reason is that the competition from other sellers is much lower in the Fall and Winter.

Let’s see what the numbers say…

We did an analysis of the number of homes that sold last year in each month versus the homes for sale that month and then looked at the ratio. For example, if 500 homes were for sale and 250 of them sold, the ratio would be 50%.

Here are the ratios for certain months in our 3 major Northern Colorado markets:

Fort Collins

  • March = 38%
  • October = 38%
  • December = 55%

Loveland

  • March = 39%
  • October = 43%
  • December = 46%

Greeley

  • March = 48%
  • October = 49%
  • December = 82%

So the numbers tell us that there is no advantage of waiting until the Spring.

Also, all of our clients who are listing their home now see the advantage of dealing with the “known” versus the “unknown” when it comes to interest rates, demand levels and other market factors.

If you would like to see the odds of selling in your particular neighborhood and your particular price range, contact me today.

BlogFort Collins Real EstateFort Collins Realtor August 24, 2017

Should You Wait or Buy Now?

The housing market is remarkably tight across the U.S., and you may be wondering if you should wait for home prices to slow before making your move. Windermere’s Chief Economist, Matthew Gardner, shares why waiting could end up costing you more money in the long run.

Should You Wait out the Housing Market?

The housing market is remarkably tight across the U.S., and you may be wondering if you should wait for home prices to slow before making your move. Windermere's Chief Economist, Matthew Gardner, shares why waiting could end up costing you more money in the long run.

Posted by Windermere Real Estate on Friday, August 18, 2017

BlogFort Collins Real EstateFort Collins RealtorFun Facts August 18, 2017

No two alike

Anyone who has more than one child is frequently amazed by the difference between the children. How is it that two kids from the same parents are so different from each other?

Same goes in our Northern Colorado market. We see a major difference between certain price ranges and certain locations right here in our little neck of the woods.

Clients are constantly reading about and hearing about the “hot” market. They make assumptions that every price range and every location in Larimer and Weld Counties are on fire. Not true!

Just like two kids from the same parents are different, two price ranges in the same place are very different.

To make this point, let’s look at months of inventory. This statistic simply measures how long it would take to sell the current inventory of homes at the current pace of sales.

Across all price ranges, months of inventory in Larimer County = 2.0. Meaning it would take two months to sell all the homes currently for sale. But this is misleading, because months of inventory…

So, the $1,000,000 seller who hears that the market is “hot” is actually faced with a year’s inventory currently on the market!

This is a very high-level look at the differences in our market. I am happy to give you a detailed look at your exact neighborhood in your exact price range. Let us know if we can help!