BlogEconomics 101Gardner ReportUncategorized March 10, 2021

Q4 2020 Colorado Real Estate Market Update

The following analysis of the Metro Denver & Northern Colorado real estate market is provided by Windermere Real Estate Chief Economist Matthew Gardner. We hope that this information may assist you with making better-informed real estate decisions. For further information about the housing market in your area, please don’t hesitate to contact your Windermere agent.

REGIONAL ECONOMIC OVERVIEW

The job recovery that appeared to be firmly in place in the summer has started to wane. Though Colorado has recovered more than 209,000 of the jobs lost due to COVID-19, employment levels remain almost 210,000 below the level seen last February. Even with employment growth stalling, the unemployment rate stands at a relatively respectable 6.4%, down from a peak of 12.2%. Regionally, unemployment levels range from a low of 5.4% in Boulder to a high of 6.9% in Greeley. Rising COVID-19 infection rates continue to impact the job recovery, and I do not see much in the way of palpable improvement until a vaccine becomes freely available, likely in the second half of this year.

COLORADO HOME SALES

❱ In the final quarter of 2020, 12,207 homes sold. This represents an increase of 21.8% compared to the fourth quarter of 2019, but 19% lower than in the third quarter. I am not concerned, though, because seasonal influences tend to impact sales in the winter.

❱ Sales rose in all markets other than El Paso compared to the fourth quarter of 2019. I believe sales are only limited by the number of homes on the market.

❱ Inventory levels remain well below what I would like to see. The average number of homes on the market in the fourth quarter was down 55% from the same period in 2019.

❱ Pending sales were 34% lower compared to the third quarter. Again, seasonality and a lack of homes to buy impact this figure. Pending sales are still 13% higher than a year ago.
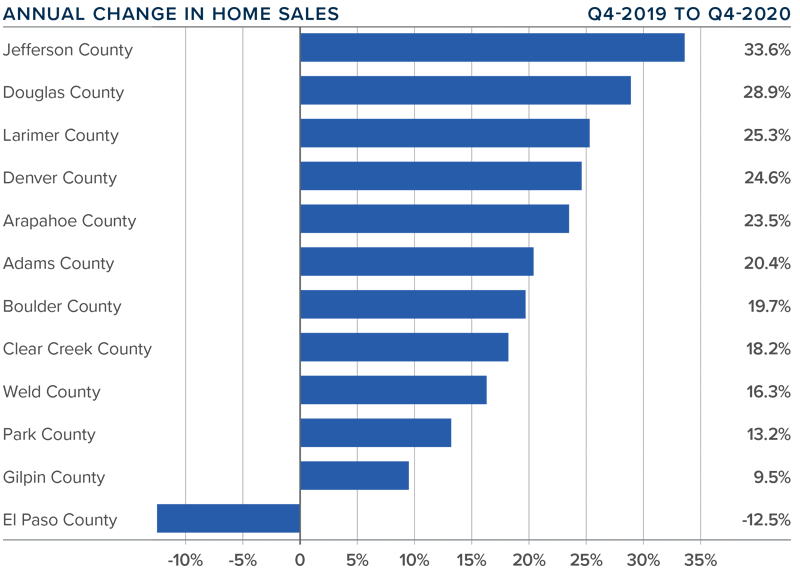
Colorado Counties Graph

COLORADO HOME PRICES

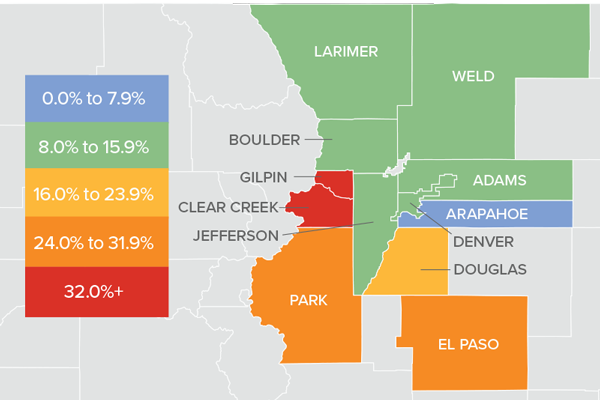
Price appreciation in various Colorado counties.

❱ Home prices rose significantly in the fourth quarter, with the average price increasing 13.7% year-over-year to $532,492. Prices were up 1.8% compared to the third quarter of this year.

❱ Interest rates are unlikely to drop much further and this will lead price growth to slow as we move through 2021.

❱ Year-over-year, prices rose across all markets covered by this report, with significant appreciation in Clear Creek, Gilpin, Park, and El Paso counties. Every county but Arapahoe saw double-digit price gains.

❱ Affordability in many Colorado markets remains a concern as prices continue to rise at well-above-average rates. That said, I anticipate we will see price growth moderate in 2021.
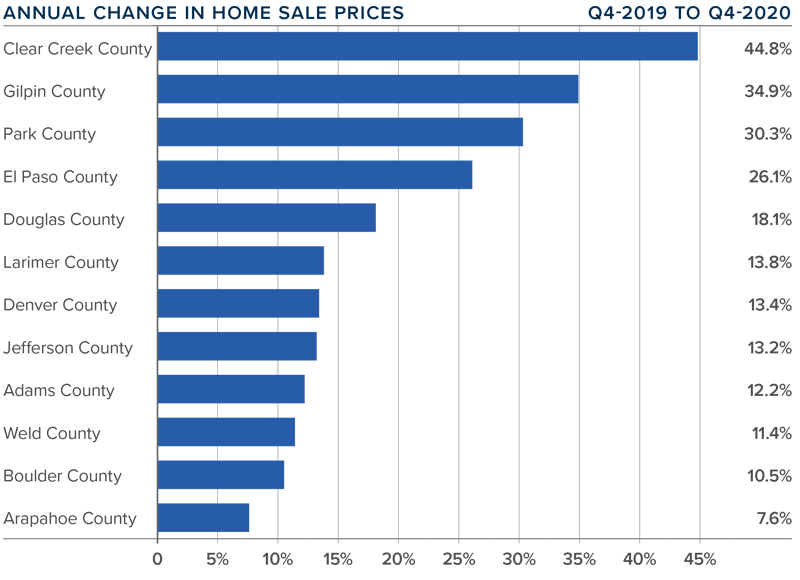
A bar graph showing the annual change in home sale prices in various Colorado counties.

DAYS ON MARKET

❱ The average number of days it took to sell a home in the markets contained in this report dropped 15 days compared to the final quarter of 2019.

❱ The amount of time it took to sell a home dropped in every county contained in this report compared to the fourth quarter of 2019.

❱ It took an average of 26 days to sell a home in the region, down 3 days compared to the third quarter of 2020.

❱ The Colorado housing market continues to demonstrate solid demand, and buyers are clearly competitive as suggested by the short length of time it is taking to sell a home.
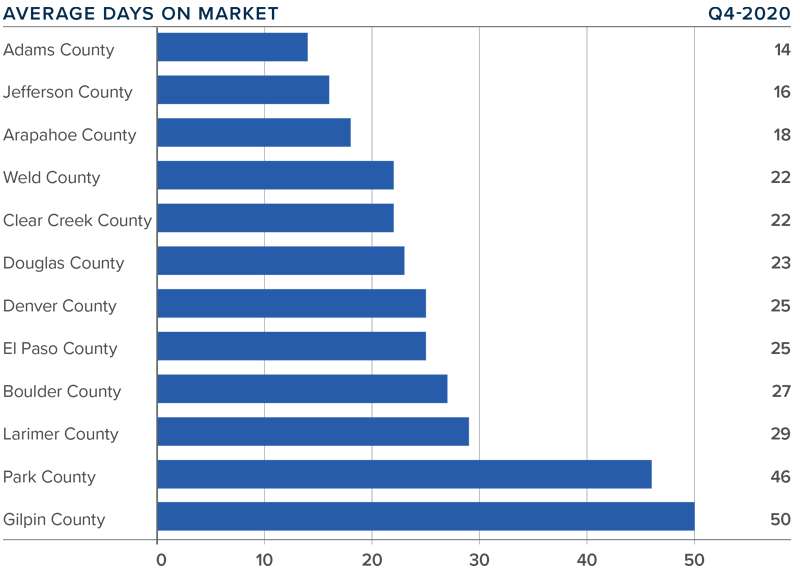
A bar graph showing the average days on market for homes in various Colorado counties

CONCLUSIONS

A speedometer graph indicating a seller's market in Colorado.

This speedometer reflects the state of the region’s real estate market using housing inventory, price gains, home sales, interest rates, and larger economic factors.

Home sales and prices are significantly higher than a year ago, and demand for housing is very much in place. Naturally, this favors home sellers who are still in control of the market. I do expect to see some improvement in listing activity this year, which, in concert with modestly rising interest rates, will likely start to take some of the steam out of the market. However, any moderation in the market has yet to appear. Even given the possible headwinds mentioned above, I am moving the needle a little more in favor of sellers, as demand is likely to exceed supply for the time being.


ABOUT MATTHEW GARDNER

Matthew Gardner - Chief Economist for Windermere Real Estate

As Chief Economist for Windermere Real Estate, Matthew Gardner is responsible for analyzing and interpreting economic data and its impact on the real estate market on both a local and national level. Matthew has over 30 years of professional experience both in the U.S. and U.K.

In addition to his day-to-day responsibilities, Matthew sits on the Washington State Governors Council of Economic Advisors; chairs the Board of Trustees at the Washington Center for Real Estate Research at the University of Washington; and is an Advisory Board Member at the Runstad Center for Real Estate Studies at the University of Washington where he also lectures in real estate economics.

Gardner Report July 24, 2020

Gardner Report – Second Quarter 2020


The following analysis of the Metro Denver & Northern Colorado real estate market is provided by Windermere Real Estate Chief Economist Matthew Gardner. We hope that this information may assist you with making better-informed real estate decisions. For further information about the housing market in your area, please don’t hesitate to contact your Windermere agent. 


ECONOMIC OVERVIEW

COVID-19 had significant negative impacts on employment in Colorado. The pandemic caused the loss of over 342,000 jobs in March and April as unemployment rose to 12.2%. For comparison, peak unemployment following the Great Recession was 8.9%. However, it appears as if the massive contraction in employment is behind us (at least for now). Employment in Colorado rose in May by 68,800 jobs, a monthly increase of 2.8%, pushing the unemployment rate down to 10.2%. Regionally, the Denver metro area added 18,600 jobs in May and the Fort Collins metro area added 3,500 jobs. It is certainly too early to say that we are out of the woods, but we seem to be headed in a positive direction. Colorado’s COVID-19 infection rates started increasing again in June, which could slow down the economic recovery. However, I do not believe that it is likely to have any substantial impact on the housing market.


HOME SALES

  • In the second quarter of 2020, 9,867 homes sold. This represents a drop of 20.7% compared to the second quarter of 2019, but sales were 7.4% higher than in the first quarter of this year.
  • Sales dropped across all markets compared to the second quarter of 2019. I do not find this concerning as the drop can be attributed to limited supply and COVID-19.
  • Inventory levels remain tight, with the average number of homes for sale in the quarter down 21.3% from the same period in 2019. However, listings were up an impressive 15.6% over the first quarter of 2020.
  • I was pleased to see total pending sales in the quarter increase 16.3% compared to the first quarter, suggesting closing data for the third quarter will be better than we are currently experiencing.


HOME PRICES

  • Home prices held steady compared to the second quarter of 2019 at an average of $480,831. Prices were up 0.7% compared to the first quarter of this year.
  • Interest rates remain at very low levels and will stay in the low 3% range for the balance of the year, if not longer. This can allow prices to pick back up.
  • Price growth across the region was varied. Seven counties saw price growth and five experienced a drop in average sale price. Clear Creek County again saw prices rise substantially. However, as you are likely aware, it is a very small market and subject to wild swings. Prices dropped most in the equally small Gilpin County.
  • I am still watching affordability in many Colorado markets and will take this temporary “pause” as a good thing.


DAYS ON MARKET

  • The average number of days it took to sell a home in the markets contained in this report dropped by only one day compared to the second quarter of 2019.
  • The amount of time it took to sell a home dropped in eight counties, remained static in one, and rose in three compared to the second quarter of 2019.
  • It took an average of 29 days to sell a home in the region.
  • The Colorado housing market is demonstrating solid demand, and listing activity is trending higher. I expect that the summer market will be brisk.


CONCLUSIONS

This speedometer reflects the state of the region’s real estate market using housing inventory, price gains, home sales, interest rates, and larger economic factors.

Demand appears to be returning, which—combined with historically low interest rates—should lead to a brisk summer housing market. Assuming that the state gets new infection rates under control, I do not see why the housing market wouldn’t perform well this summer. As such, I have moved the needle just a little more in favor of home sellers.

ABOUT MATTHEW GARDNER

As Chief Economist for Windermere Real Estate, Matthew Gardner is responsible for analyzing and interpreting economic data and its impact on the real estate market on both a local and national level. Matthew has over 30 years of professional experience both in the U.S. and U.K.

In addition to his day-to-day responsibilities, Matthew sits on the Washington State Governors Council of Economic Advisors; chairs the Board of Trustees at the Washington Center for Real Estate Research at the University of Washington; and is an Advisory Board Member at the Runstad Center for Real Estate Studies at the University of Washington where he also lectures in real estate economics.


Gardner ReportMarket News July 30, 2019

Colorado Real Estate Market Update

The following analysis of the Metro Denver & Northern Colorado real estate market (which now includes Clear Creek, Gilpin, and Park counties) is provided by Windermere Real Estate Chief Economist Matthew Gardner. We hope that this information may assist you with making better-informed real estate decisions. For further information about the housing market in your area, please don’t hesitate to contact your Windermere agent. 


ECONOMIC OVERVIEW

Colorado’s economy continues to grow with the addition of 45,900 new non-agricultural jobs over the past 12 months, which represents a growth rate of 1.7%. As I have stated in the last two Gardner Reports, we continue to see a modest slowdown in employment gains, but that is to be expected at this stage of the business cycle.

In May, the state unemployment rate was 3.2%, up from 3.1% a year ago. The increase in the rate is essentially due to labor force growth, which rose by over 55,700 people over the past year. On a seasonally adjusted basis, unemployment rates in all the markets contained in this report were lower than a year ago and are at full employment.


HOME SALES

  • In the second quarter of 2019, 17,853 homes sold. This is a drop of 1% compared to the second quarter of 2018 but a substantial 59.9% higher than the first quarter of this year. Pending sales — a sign of future closings — rose 5.8%, suggesting that closings in the third quarter are likely to show further improvement.
  • Half of the counties contained in this report saw sales growth, while the other half had fewer closings. Sales in the small Clear Creek County fell precipitously. However, it was only a drop of 20 sales.
  • The marginal drop in the number of sales compared to a year ago can be attributed to the ongoing increase in listing activity (+34.8%), which continues to give would-be home buyers more choice and less urgency.
  • Inventory levels continue to rise, but demand for housing appears to be ongoing. I am not concerned by the marginal year-over-year slowdown and anticipate that sales will rise again in the third quarter.


HOME PRICES

  • Home prices continue to trend higher, but the rate of growth has taken a pause, with the average home price in the region rising by just 2.3% year-over-year to $490,575.
  • The drop in interest rates this year has nudged more buyers off the fence and this can allow further price growth as we move through the year.
  • Appreciation was again strongest in Park County, where prices rose 6.1%. We also saw strong growth in Weld County, which rose by 6.1%. Home prices dropped in Clear Creek, Boulder, and Gilpin counties, but I do not see this as being indicative of a trend in these markets.
  • Affordability continues to be an issue in many Colorado markets and this may act as a modest headwind to ongoing price growth. However, some of the slowing may be offset by very favorable mortgage rates.


DAYS ON MARKET

  • The average number of days it took to sell a home in the markets contained in this report rose four days over the second quarter of 2018.
  • The amount of time it took to sell a home rose in all counties except Gilpin when compared to the second quarter of 2018.
  • It took an average of 29 days to sell a home in the region — a drop of 13 days compared to the first quarter of this year.
  • It is likely that the drop in time-on-market was a function of the emerging spring selling season as well as falling mortgage rates.


CONCLUSIONS


This speedometer reflects the state of the region’s real estate market using housing inventory, price gains, home sales, interest rates, and larger economic factors.

For the second quarter of 2019, I continue the trend I started last summer and have moved the needle a little more in favor of buyers. I continue to closely monitor listing activity to see if we get any major bumps above the traditional increase because that may further slow home price growth. However, the trend for 2019 will continue to be a move toward a more balanced market.


ABOUT MATTHEW GARDNER


As Chief Economist for Windermere Real Estate, Matthew Gardner is responsible for analyzing and interpreting economic data and its impact on the real estate market on both a local and national level. Matthew has over 30 years of professional experience both in the U.S. and U.K.

In addition to his day-to-day responsibilities, Matthew sits on the Washington State Governors Council of Economic Advisors; chairs the Board of Trustees at the Washington Center for Real Estate Research at the University of Washington; and is an Advisory Board Member at the Runstad Center for Real Estate Studies at the University of Washington where he also lectures in real estate economics.


BlogFun Facts May 10, 2019

Inventory vs. Sales

A stat we find interesting is the relationship between the inventory for sale versus what is actually selling.

Specifically what we look at are price ranges.

We are curious to know if the inventory that is for sale lines up with what the buyers want.

Here’s what we notice…

In Larimer County, 23% of all the single family homes for sale are priced under $400,000. No surprise, this is a popular price range among buyers and it represents 45% of all sales.

So, the ratio is 23% of the inventory versus 45% of the sales.

In Weld County, the difference is more pronounced.

Homes under $400,000 represent 44% of the inventory and 69% of the sales.

Because the percentage of sales is higher than the percentage of inventory, properties under $400,000 will sell much quicker and are more likely to have multiple offers.

To see the latest on the market, be sure to check out a copy of the new Gardner Report, our Chief Economist’s quarterly look at Front Range real estate.

Gardner ReportNorthern Colorado Real Estate April 30, 2018

The Gardner Report


The following analysis of the Metro Denver & Northern Colorado real estate market is provided by Windermere Real Estate Chief Economist Matthew Gardner. We hope that this information may assist you with making better-informed real estate decisions. For further information about the housing market in your area, please don’t hesitate to contact me.


ECONOMIC OVERVIEW

It’s good news for the state of Colorado, which saw annual employment grow in all of the metropolitan markets included in this report. The state added 63,400 non-agricultural jobs over the past 12 months, an impressive growth rate of 2.4%. Colorado has been adding an average of 5,300 new jobs per month for the past year, and I anticipate that this growth rate will continue through the balance of 2018.

In February, the unemployment rate in Colorado was 3.0%—a level that has held steady for the past six months. Unemployment has dropped in all the markets contained in this report, with the lowest reported rates in Fort Collins and Denver, where 3.1% of the labor force was actively looking for work. The highest unemployment rate was in Grand Junction, which came in at 4.6%.


HOME SALES ACTIVITY

  • In the first quarter of 2018, there were 11,173 home sales—a drop of 5.6% when compared to the first quarter of 2017.
  • With an increase of 5.3%, home sales rose the fastest in Boulder County, as compared to first quarter of last year. There was also a modest sales increase of 1.2% in Larimer County. Sales fell in all the other counties contained within this report.
  • Home sales continue to slow due to low inventory levels, which were down 5.7% compared to a year ago.
  • The takeaway here is that sales growth continues to stagnate due to the lack of homes for sale.


HOME PRICES

  • Strong economic growth, combined with limited inventory, continued to push prices higher. The average home price in the markets covered by this report was up by 11.7% year-over-year to $448,687.
  • Arapahoe County saw slower appreciation in home values, but the trend is still positiveand above its long-term average.
  • Appreciation was strongest in Boulder County, which saw prices rise 14.8%. Almost all other counties in this report experienced solid gains.
  • The ongoing imbalance between supply and demand persists and home prices continue to appreciate at above-average rates.


DAYS ON MARKET

  • The average number of days it took to sell a home dropped by three days when compared to the first quarter of 2017.
  • Homes in all but two counties contained in this report took less than a month to sell. Adams County continues to stand out where it took an average of just 17 days to sell a home.
  • During the first quarter, it took an average of 27 days to sell a home. That rate is down 2 days from the fourth quarter of 2017.
  • Housing demand remains strong and would-be buyers should expect to see stiff competition for well-positioned, well-priced homes.


CONCLUSIONS

This speedometer reflects the state of the region’s housing market using housing inventory, price gains, home sales, interest rates, and larger economic factors. In the first quarter of 2018, I have left the needle where it was in the fourth quarter of last year. Even as interest rates trend higher, it appears as if demand will continue to outweigh supply. As we head into the spring months, I had hoped to see an increase in the number of homes for sale, but so far that has not happened. As a result, the housing market continues to heavily favor sellers.


Matthew Gardner is the Chief Economist for Windermere Real Estate, specializing in residential market analysis, commercial/industrial market analysis, financial analysis, and land use and regional economics. He is the former Principal of Gardner Economics, and has more than 30 years of professional experience both in the U.S. and U.K.


BlogFun FactsGardner Report November 5, 2017

Colorado Real Estate Market Update

ECONOMIC OVERVIEW

Colorado added 45,800 non-agricultural jobs over the past 12 months, a growth rate of 1.8%. Within the metropolitan market areas included in this report, annual employment growth was seen in all areas other than Grand Junction (where employment was stable) with substantial growth seen in Fort Collins (4.6%) and Greeley (3.5%).

In August, the unemployment rate in the state was 2.2%, down from 3.1% a year ago. The lowest reported unemployment rates were again seen in Fort Collins at just 1.8%. The highest rate was in Grand Junction, at a very respectable 3.0%. It is still reasonable to assume that all the markets contained within this report will see above-average wage growth given the very tight labor market.

HOME SALES ACTIVITY

  • There were 17,140 home sales during the third quarter of 2017, which was a drop of 3.3% from the same period in 2016.
  • Sales rose the fastest in Boulder County, which saw sales grow 4% more than the third quarter of 2016. There were marginal increases in Weld and Larimer Counties. Sales fell in all the other counties contained within this report.
  • Home sales slowed due to very low levels of available inventory. Listing activity continues to trend at well below historic averages, with the total number of homes for sale in the third quarter 5.5% below the level seen a year ago.
  • The takeaway here is that sales growth has stalled due to the lack of homes for sale.

HOME PRICES

  • With substantial competition for the few available homes, prices continue to rise. Average prices were up 7.5% year-over-year to a regional average of $428,602.
  • Slower appreciation in home values was again seen in Boulder County, but the trend is still positive.
  • Appreciation was strongest in Weld County, which saw prices rise 12%.
  • Due to an ongoing imbalance between supply and demand, home prices will continue to appreciate at above-average rates for the foreseeable future.


DAYS ON MARKET

  • The average number of days it took to sell a home dropped by one day when compared to the third quarter of 2016.
  • Homes in all counties contained in this report took less than a month to sell. Adams County continues to stand out as it took an average of just two weeks to sell a home there.
  • During the third quarter, it took an average of 20 days to sell a home. This is up by 3 days compared to the second quarter of this year.
  • Demand remains strong, and well-positioned, well-priced homes continue to sell very quickly.

CONCLUSIONS

This speedometer reflects the state of the region’s housing market using housing inventory, price gains, home sales, interest rates, and larger economic factors.

In the third quarter of 2017, I have chosen to leave the needle where it was in the second quarter. Homes are still scarce; however, there is a small slowdown in price growth and a decline in both closed and pending sales. This may suggest the market is either getting weary of all the competition or that would-be buyers are possibly putting off buying until they see more choices in the number of homes for sale.


Matthew Gardner is the Chief Economist for Windermere Real Estate, specializing in residential market analysis, commercial/industrial market analysis, financial analysis, and land use and regional economics. He is the former Principal of Gardner Economics, and has more than 30 years of professional experience both in the U.S. and U.K.


If you are in the market to buy or sell, let me know!  I am happy to help!