BlogFun Facts September 27, 2020

6 Million

Based on the numbers through August, we are now on pace to sell 6 million homes.  This is the highest pace we have seen in 14 years.

The 6 million threshold is a big deal in the real estate brokerage world.

Each month, as they have for a long time, the National Association of Realtors tracks the sales and then calculates the annualized rate of residential closings.

For many, many years this number has bounced around 5.5 million.  The fact that it just jumped to 6 million speaks to many factors especially the effect of today’s interest rates.

running

At Windermere Real Estate we are taking Safer at Home and Social Distancing very seriously.  Our people are following our Safe Showings protocol, staying connected to their clients, and providing help wherever needed.


BlogFun Facts September 18, 2020

Pendings are Popping

Typically the market starts to slow down a bit in the Fall after a hot Spring and Summer.

Not this year.

The indicator we use to measure future closed sales is current pending sales.

Simply, we look at the number of properties under contract and scheduled to close versus the same time last year.

Current pending sales are way up along the Front Range when measured against 2019:

Metro Denver up 34.1%

Larimer County up 48.6%

Weld County up 50.2%

Based on these numbers, closed sales numbers over the next 60 days will be very strong.

bubbles

At Windermere Real Estate we are taking Safer at Home and Social Distancing very seriously.  Our people are following our Safe Showings protocol, staying connected to their clients, and providing help wherever needed.

BlogFun Facts September 11, 2020

Forbearance Falls

This is good news for the real estate market.

Less and less people are seeking payment relief on their mortgages.

The number of loans currently in forbearance stands at 7.16%.

This news coincides with the U.S. Unemployment Rate falling to it’s lowest level in 5 months as more people are getting their jobs back.

The economy has added back roughly half of the 22.2 million jobs that were lost in March and April of this year.

waterfall

At Windermere Real Estate we are taking Safer at Home and Social Distancing very seriously.  Our people are following our Safe Showings protocol, staying connected to their clients, and providing help wherever needed.

BlogFun Facts September 4, 2020

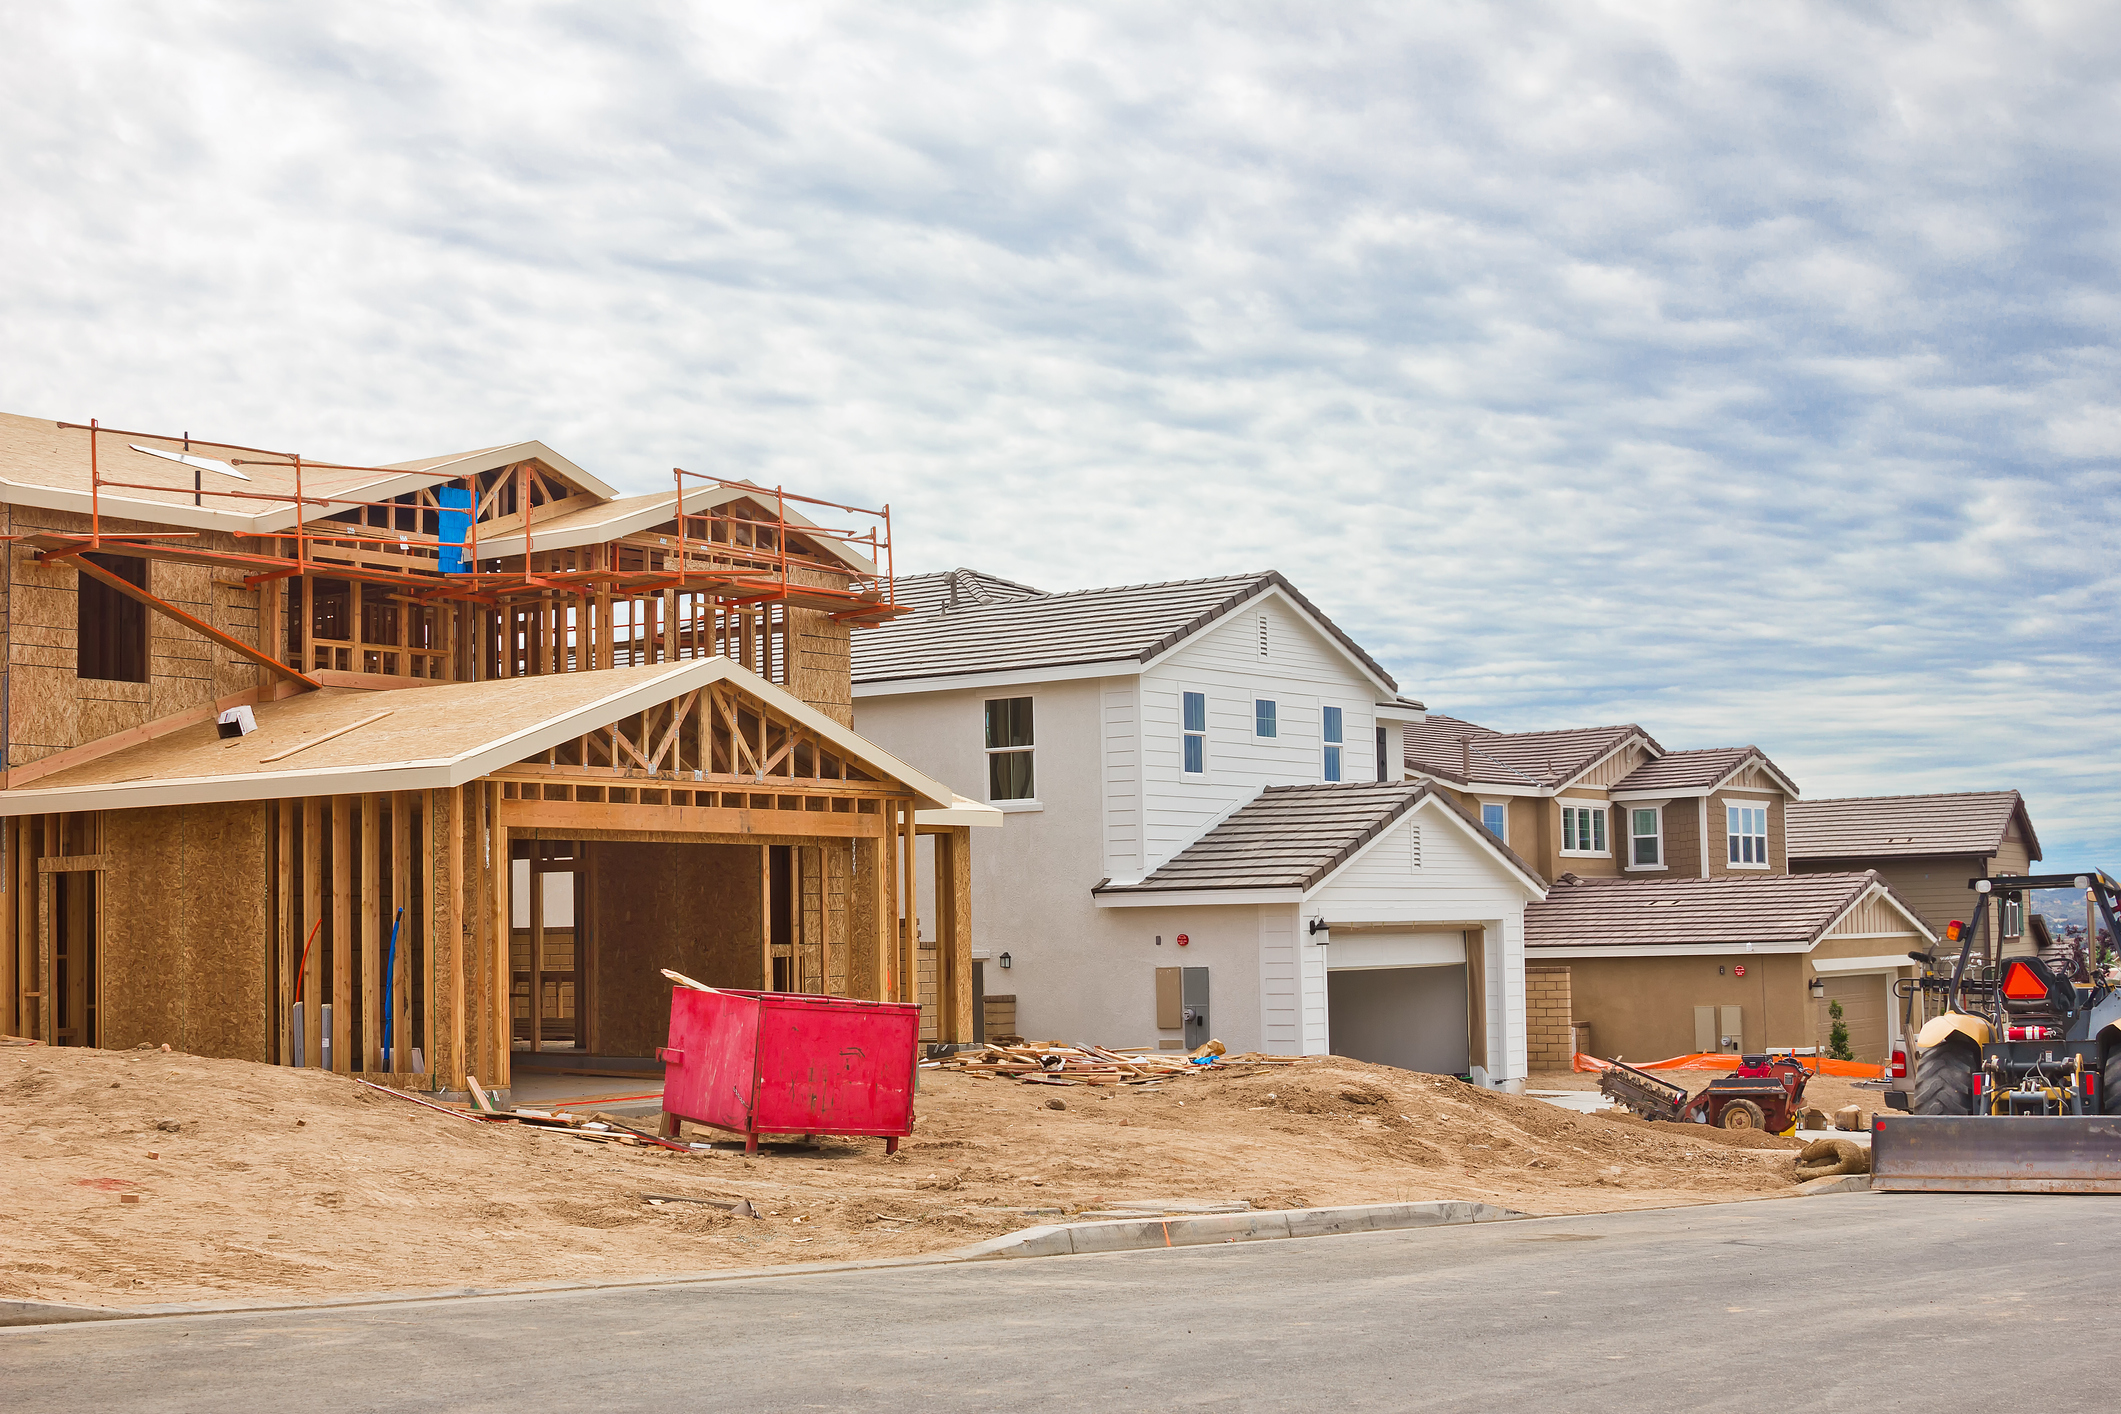
New Home Surge

The annualized rate of single-family new construction homes is now at 901,000 according to the new Census Bureau report.

This means that across the U.S., at the current pace of sales, there will be almost 1,000,000 new homes built and sold over the next 12 months.

This pace is 36% higher than one year ago and the highest it has been since the end of 2006.

Given the low inventory levels of previously-owned homes that most of the Country is experiencing, this uptick in new home activity is welcome news.

new home

At Windermere Real Estate we are taking Safer at Home and Social Distancing very seriously.  Our people are following our Safe Showings protocol, staying connected to their clients, and providing help wherever needed.


BlogFun Facts August 28, 2020

Price Report

Some significant findings from the report:

House prices have risen for 36 consecutive quarters, or since September 2011.

House prices rose in all 50 states and the District of Columbia between the second quarters of 2019 and 2020.

The top five areas for annual appreciation were:

1) Idaho 10.8%

2) Arizona 9.1%

3) Washington 8.6%

4) Utah 8.1%

5) New Mexico 7.7%.

Idaho has been the leading state for the last 7 quarters.

Colorado showed annual appreciation of 4.4%.

The areas showing the lowest annual appreciation were:

1) West Virginia 1.1%

2) North Dakota 1.1%

3) District of Columbia 1.4%

4) Illinois 2.5%

5) Alaska 2.6%.

House prices rose in 99 of the top 100 largest metropolitan areas in the U.S. over the last four quarters.

Annual price increases were greatest in Honolulu, HI, where prices increased by 11.7%.

Prices were weakest in San Francisco, where they decreased by 0.3%.

Plane

At Windermere Real Estate we are taking Safer at Home and Social Distancing very seriously.  Our people are following our Safe Showings protocol, staying connected to their clients, and providing help wherever needed.


Blogloveland real estateVirtual Tours August 14, 2020

Charming Brick Beauty!

Amazing brick ranch home on .23 acres with NO HOA awaits! You will love the way 2325 Farisita Dr Loveland, CO flows from room to room! The home has been freshly painted with beautiful grey and white colors throughout and new LVP flooring installed on the main level. 3 bedrooms and 2 bathrooms are on the main level. The basement boasts a large family room and an additional bedroom and bathroom. The home was built in 1973 and has an incredible amount of built in storage on both levels of the home. Finally, imagine sitting in the sunroom at the back of the home enjoying an abundant amount of sunlight while watching your pets play in the fenced in back yard. The above-ground pool is an optional inclusion. Seller will remove it if the Buyer does not want it. Call for your private showing at (970) 401-0123 for more information or click the link below for more details.

http://windermerenoco.com/listing/112964016

BlogFun Facts July 31, 2020

Spring in Summer

Typically the busiest months for real estate along the Front Range are April, May and June.

This year, because showing activity was restricted in the Spring months, we are seeing robust activity this Summer.

Here’s an indicator.  Sales through July 2020 versus July 2019 are up:

  • 12.6% in Metro Denver
  • 17% in Northern Colorado

To see double-digit increases in sales despite was is occurring in the National economy, is nothing short of remarkable.

At Windermere Real Estate we are taking Safer at Home and Social Distancing very seriously.  Our people are following our Safe Showings protocol, staying connected to their clients, and providing help wherever needed.


Gardner Report July 24, 2020

Gardner Report – Second Quarter 2020


The following analysis of the Metro Denver & Northern Colorado real estate market is provided by Windermere Real Estate Chief Economist Matthew Gardner. We hope that this information may assist you with making better-informed real estate decisions. For further information about the housing market in your area, please don’t hesitate to contact your Windermere agent. 


ECONOMIC OVERVIEW

COVID-19 had significant negative impacts on employment in Colorado. The pandemic caused the loss of over 342,000 jobs in March and April as unemployment rose to 12.2%. For comparison, peak unemployment following the Great Recession was 8.9%. However, it appears as if the massive contraction in employment is behind us (at least for now). Employment in Colorado rose in May by 68,800 jobs, a monthly increase of 2.8%, pushing the unemployment rate down to 10.2%. Regionally, the Denver metro area added 18,600 jobs in May and the Fort Collins metro area added 3,500 jobs. It is certainly too early to say that we are out of the woods, but we seem to be headed in a positive direction. Colorado’s COVID-19 infection rates started increasing again in June, which could slow down the economic recovery. However, I do not believe that it is likely to have any substantial impact on the housing market.


HOME SALES

  • In the second quarter of 2020, 9,867 homes sold. This represents a drop of 20.7% compared to the second quarter of 2019, but sales were 7.4% higher than in the first quarter of this year.
  • Sales dropped across all markets compared to the second quarter of 2019. I do not find this concerning as the drop can be attributed to limited supply and COVID-19.
  • Inventory levels remain tight, with the average number of homes for sale in the quarter down 21.3% from the same period in 2019. However, listings were up an impressive 15.6% over the first quarter of 2020.
  • I was pleased to see total pending sales in the quarter increase 16.3% compared to the first quarter, suggesting closing data for the third quarter will be better than we are currently experiencing.


HOME PRICES

  • Home prices held steady compared to the second quarter of 2019 at an average of $480,831. Prices were up 0.7% compared to the first quarter of this year.
  • Interest rates remain at very low levels and will stay in the low 3% range for the balance of the year, if not longer. This can allow prices to pick back up.
  • Price growth across the region was varied. Seven counties saw price growth and five experienced a drop in average sale price. Clear Creek County again saw prices rise substantially. However, as you are likely aware, it is a very small market and subject to wild swings. Prices dropped most in the equally small Gilpin County.
  • I am still watching affordability in many Colorado markets and will take this temporary “pause” as a good thing.


DAYS ON MARKET

  • The average number of days it took to sell a home in the markets contained in this report dropped by only one day compared to the second quarter of 2019.
  • The amount of time it took to sell a home dropped in eight counties, remained static in one, and rose in three compared to the second quarter of 2019.
  • It took an average of 29 days to sell a home in the region.
  • The Colorado housing market is demonstrating solid demand, and listing activity is trending higher. I expect that the summer market will be brisk.


CONCLUSIONS

This speedometer reflects the state of the region’s real estate market using housing inventory, price gains, home sales, interest rates, and larger economic factors.

Demand appears to be returning, which—combined with historically low interest rates—should lead to a brisk summer housing market. Assuming that the state gets new infection rates under control, I do not see why the housing market wouldn’t perform well this summer. As such, I have moved the needle just a little more in favor of home sellers.

ABOUT MATTHEW GARDNER

As Chief Economist for Windermere Real Estate, Matthew Gardner is responsible for analyzing and interpreting economic data and its impact on the real estate market on both a local and national level. Matthew has over 30 years of professional experience both in the U.S. and U.K.

In addition to his day-to-day responsibilities, Matthew sits on the Washington State Governors Council of Economic Advisors; chairs the Board of Trustees at the Washington Center for Real Estate Research at the University of Washington; and is an Advisory Board Member at the Runstad Center for Real Estate Studies at the University of Washington where he also lectures in real estate economics.


BlogFun Facts July 10, 2020

More Homes Needed

More homes are needed to fulfill the need to buyer demand.

Compared to exactly one year ago, the supply of homes is down:

  • 32.6% in Metro Denver
  • 25.1% in Northern Colorado

An interesting and useful measurement we track is months of inventory.  This stat tells how long it would take to sell all of the homes currently for sale at the current pace of sales.

Of course, months of supply can vary greatly by price range and location.  However, this stat does a good job of explaining the overall state of the market.

Specifically, months of supply tells us if the market is in balance.

A ‘balanced’ market is when there is 4 to 6 months of supply.  A buyers market occurs when the stat is higher than this range.  A sellers market occurs when it is lower.

The months of supply looks like this in our market:

  • 1.0 months in Metro Denver
  • 1.3 months in Northern Colorado

So, the market overall is significantly under-supplied and more homes are needed to meet demand.

At Windermere Real Estate we are taking Safer at Home and Social Distancing very seriously.  Our people are following our Safe Showings protocol, staying connected to their clients, and providing help wherever needed.


BlogFun Facts June 26, 2020

Caught Up

Back in April, real estate activity was significantly limited and the showing of property was restricted which caused the number of closed properties in May and early June to be much lower than last year.

Bottom line, fewer properties going under contract in April caused fewer closings 30 to 45 days later.

Closed properties in May were down compared to 2019 by 44% in Northern Colorado and 43% in Metro Denver.

Then activity jumped significantly in May.  The number of properties going under contract was way up compared to last year.

We’ve been wondering when we would see this sales activity reflected in the number of closed properties.

Well, it finally happened (almost).

The number of closings so far in June compared to the same time period through June of 2019 is only down 1.8% in Northern Colorado and 1.6% in Metro Denver.

In both markets, there are only a handful of closings separating activity in June 2020 versus June 2019.

By the end of the month, when all the transactions are tallied up, we expect that June of this year will out pace June of last year in terms of number of transactions.

This is significant not only because of COVID-19, but also because of the reduced inventory compared to last year.  Quite simply, there are fewer homes to buy.

All of this speaks to the health and resiliency of the Front Range market.

At Windermere Real Estate we are taking Safer at Home and Social Distancing very seriously.  Our people are following our Safe Showings protocol, staying connected to their clients, and providing help wherever needed