Fort Collins Real EstateFun Facts March 1, 2019

Vegas Baby


The results are in from FHFA.gov’s latest ranking of the top performing markets in the U.S.

Each quarter they track 245 cities across the country and rank their real estate markets by home price appreciation.

What’s the highest performing city the the U.S.

Vegas!  Their prices have gone up 17.63% in the last year.

How about the worst?

Bloomington, Illinois sits in dead last where prices went down 3.58%

Here’s how Colorado cities are ranked:

    • #10 Colo. Springs = 11.41%
• #16 Greeley = 10.68%
• #59 Fort Collins = 8.29%
• #64 Denver = 8.15%
• #97 Boulder = 6.85%

Fort Collins Real EstateFort Collins RealtorFun FactsWindsor Real Estate February 23, 2019

4 in 40

Did you know, according to FHFA, process in Larimer County have dropped more than 1% only 4 times in the last 40 years?
FHFA stands for the Federal Housing Finance Authority. We are one of 261 markets that they track. Since 1978 they have been measuring home price appreciation here.
If you look at the appreciation numbers for each individual year, you will notice that most years the prices go up and some years the prices go down.
But there have only been 4 times in those 40 years where prices decreased more than 1%
Here’s what happened those 4 times:
• 1982 = -3.99%
• 1987 = -1.86%
• 2008 = -2.29%
• 2010 = -1.12%
Sometimes we hear buyers say that they would like to wait for the “prices to come crashing down.” The reality is that the price drops don’t happen all that often and when they do, they don’t drop by that much at all.
If you would like to see a short video with a recap of our annual Market Forecast presentation, watch the video below.
ForecastFort Collins Real EstateFort Collins Realtor February 12, 2019

2019 Annual Forecast

BlogFort Collins Real EstateFort Collins RealtorNorthern Colorado Real EstateWindsor Real Estate January 21, 2019

OUR FORECAST

This past Wednesday and Thursday evenings we had the pleasure of hosting our annual Market Forecast events in Denver and Fort Collins.

Thank you to the 700 people who attended both events. We appreciate your support!

In case you missed the events, here are some highlights including our forecast for price appreciation in 2019:
• In 2018 Prices went up:
o 8% in Fort Collins
o 8% in Loveland
o 8.5% in Greeley
o 8% in Metro Denver

 Inventory is (finally) showing signs of increasing:
o Up 25% in Northern Colorado
o Up 45% in Metro Denver

• There are distinct differences in months of inventory across different price ranges = opportunity for the move up buyer.

• There are several reasons why we don’t see a housing bubble forming:
o New home starts along the Front Range are roughly 60% of pre-bubble highs 14 years ago.
o Americans have more equity in their homes than ever, $6 Trillion!
o The average FICO score of home buyers is significantly higher than the long-term average.
o The home ownership rate is back to the long-term average.

• Our 2019 Price Appreciation Forecast:
o 6% in Fort Collins
o 6% in Loveland
o 7% in Greeley
o 6% in Metro Denver

If you would like a copy of the presentation, go ahead and reach out to me.  I would be happy to put it in your hands!

Fort Collins RealtorFun Facts October 21, 2018

A History Lesson

One of the most common questions we hear from clients is “Where do you think interest rates are going?”

Virtually all of the experts we follow put rates above 5% going into next year and some see rates approaching 5.5% by the middle of 2019. What’s certain is that there are economic forces at work that are pushing rates higher.

So, how about a little history lesson? How do today’s 30- year mortgage rates compare to this same date in history going all the way back to 1990?

• Today = 4.85%
• 2017 = 3.94%
• 2015 = 3.82%
• 2010 = 4.27%
• 2005 = 5.98%
• 2000 = 7.84%
• 1995 = 7.75%
• 1990 = 10.22%

While today’s rates feel high only because they are higher than 2017, they are quite a bit lower than at many times in history.

Timnath Real EstateVirtual Tours October 8, 2018

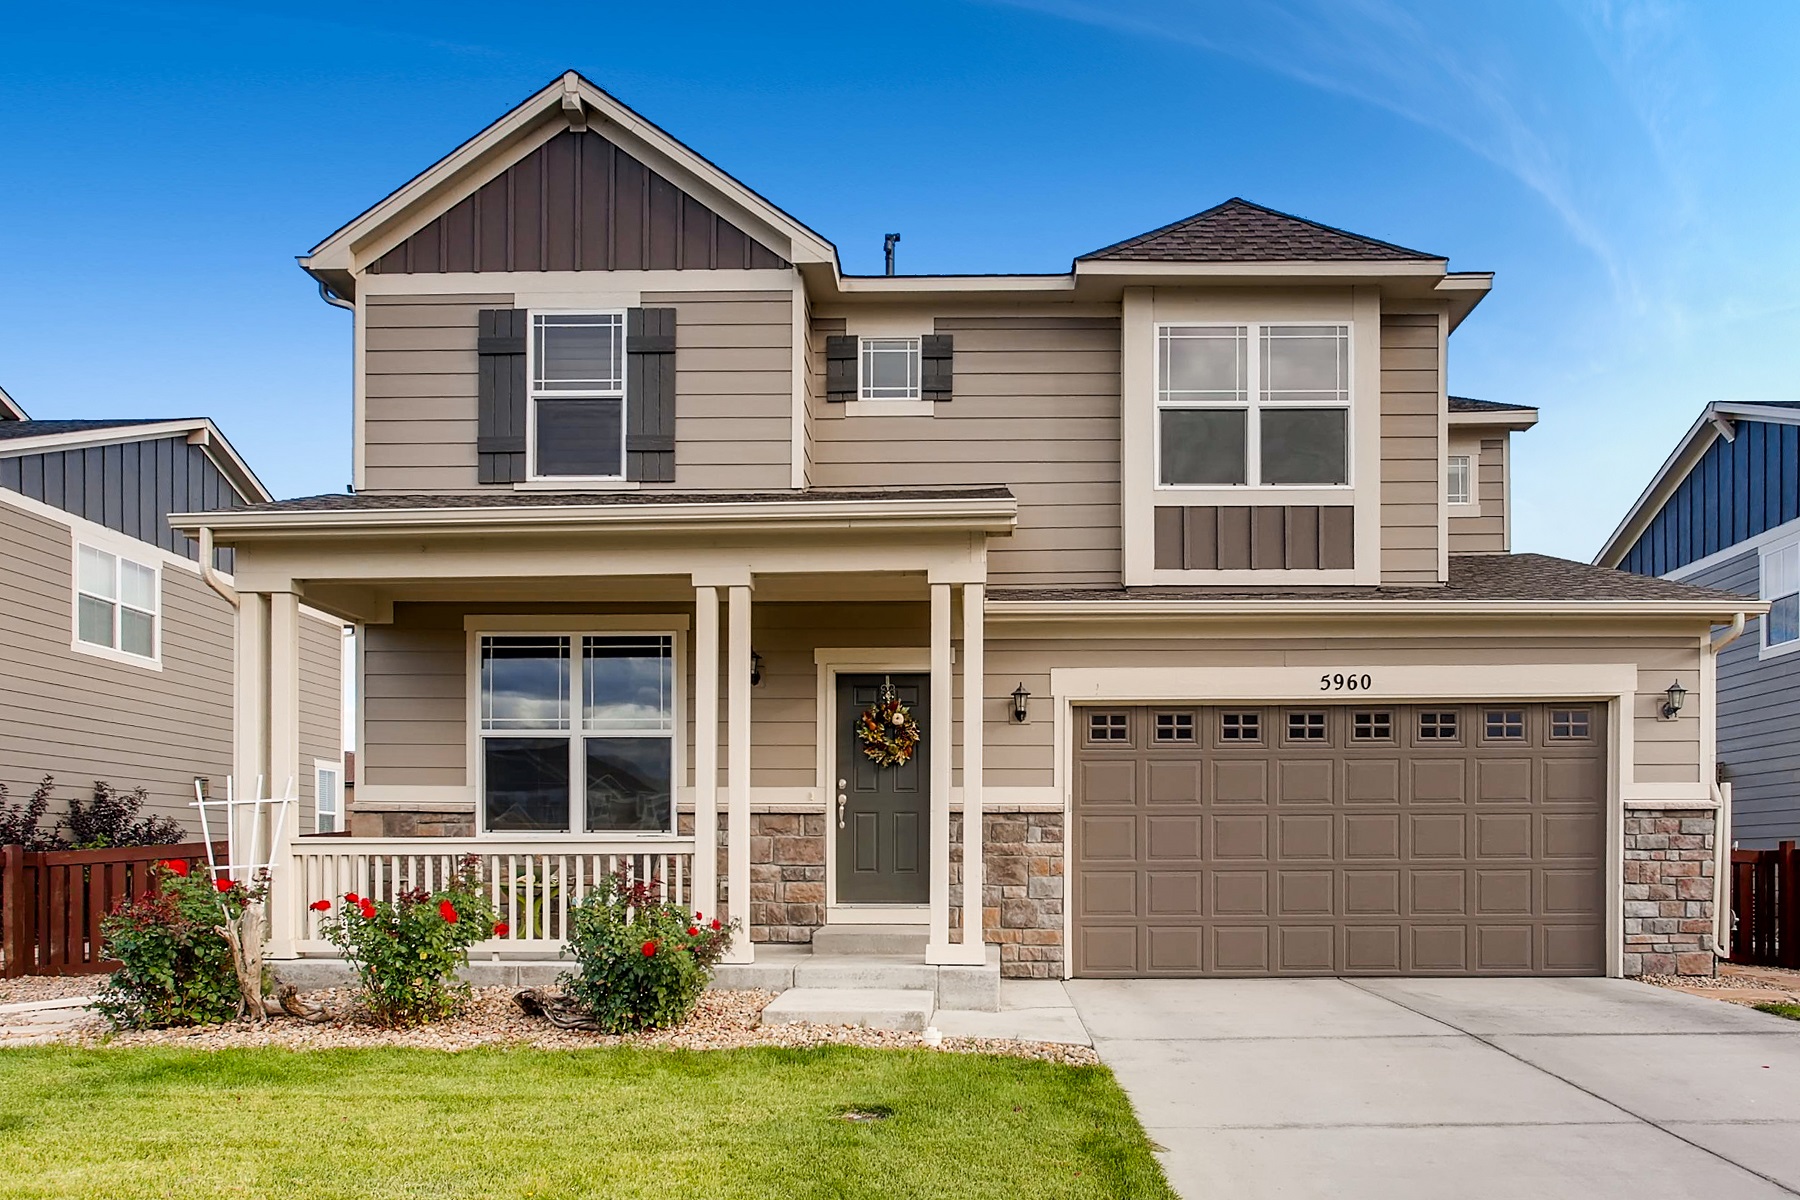
Gorgeous Two Story Home in Timnath!

This gorgeous two story home at 5960 Jasper St in Timnath Ranch awaits. This 3 bedroom, 3 bathroom home has an open floor plan and has been updated throughout with granite counters, stainless steel appliances, lighting, plantation style shutters and much more. The beautifully landscaped back yard backs up to a greenbelt giving you more space and privacy between your neighbors. Enjoy the community pool, clubhouse and fitness center as an added bonus. Call for your private showing at 970-401-0123 for more information or click the link below for more details.

http://windermerenoco.com/listing/87379672

BlogFort Collins Real EstateFort Collins RealtorFun FactsNorthern Colorado Real Estate September 7, 2018

The Cost of Waiting

It’s true, certain parts of our market are cooling off. We are seeing fewer multiple offers, fewer bidding wars, and fewer inspection concessions.
However, homes that are priced right and in great condition are selling, and in many cases, selling quickly.

As buyers feel the market cool a bit, it may cause them to want to wait. They sometimes feel like it’s a better choice to ‘wait and see what happens.’

The reality is, there is a real cost to waiting given two specific facts.

1. Interest rates will continue to rise
2. Prices will continue to rise

Interest rates are a little more than 0.5% higher than a year ago and experts predict them to be another 0.5% higher by this time next year.

Prices have been appreciating at roughly 10% per year for the last four years. Based on the numbers, we see that appreciation could be 5% per year for the next two years.

So, let’s look at a house priced at $450,000 today. If prices go up “only” 5% for the next 12 months, that home will cost $22,500 more in a year.

And, if rates go up another half percent, the monthly payment will be $206 higher. That’s an 11% increase!

In an environment of rising prices and rising rates, there is a real cost to “wait and see.”

loveland real estateVirtual Tours August 13, 2018

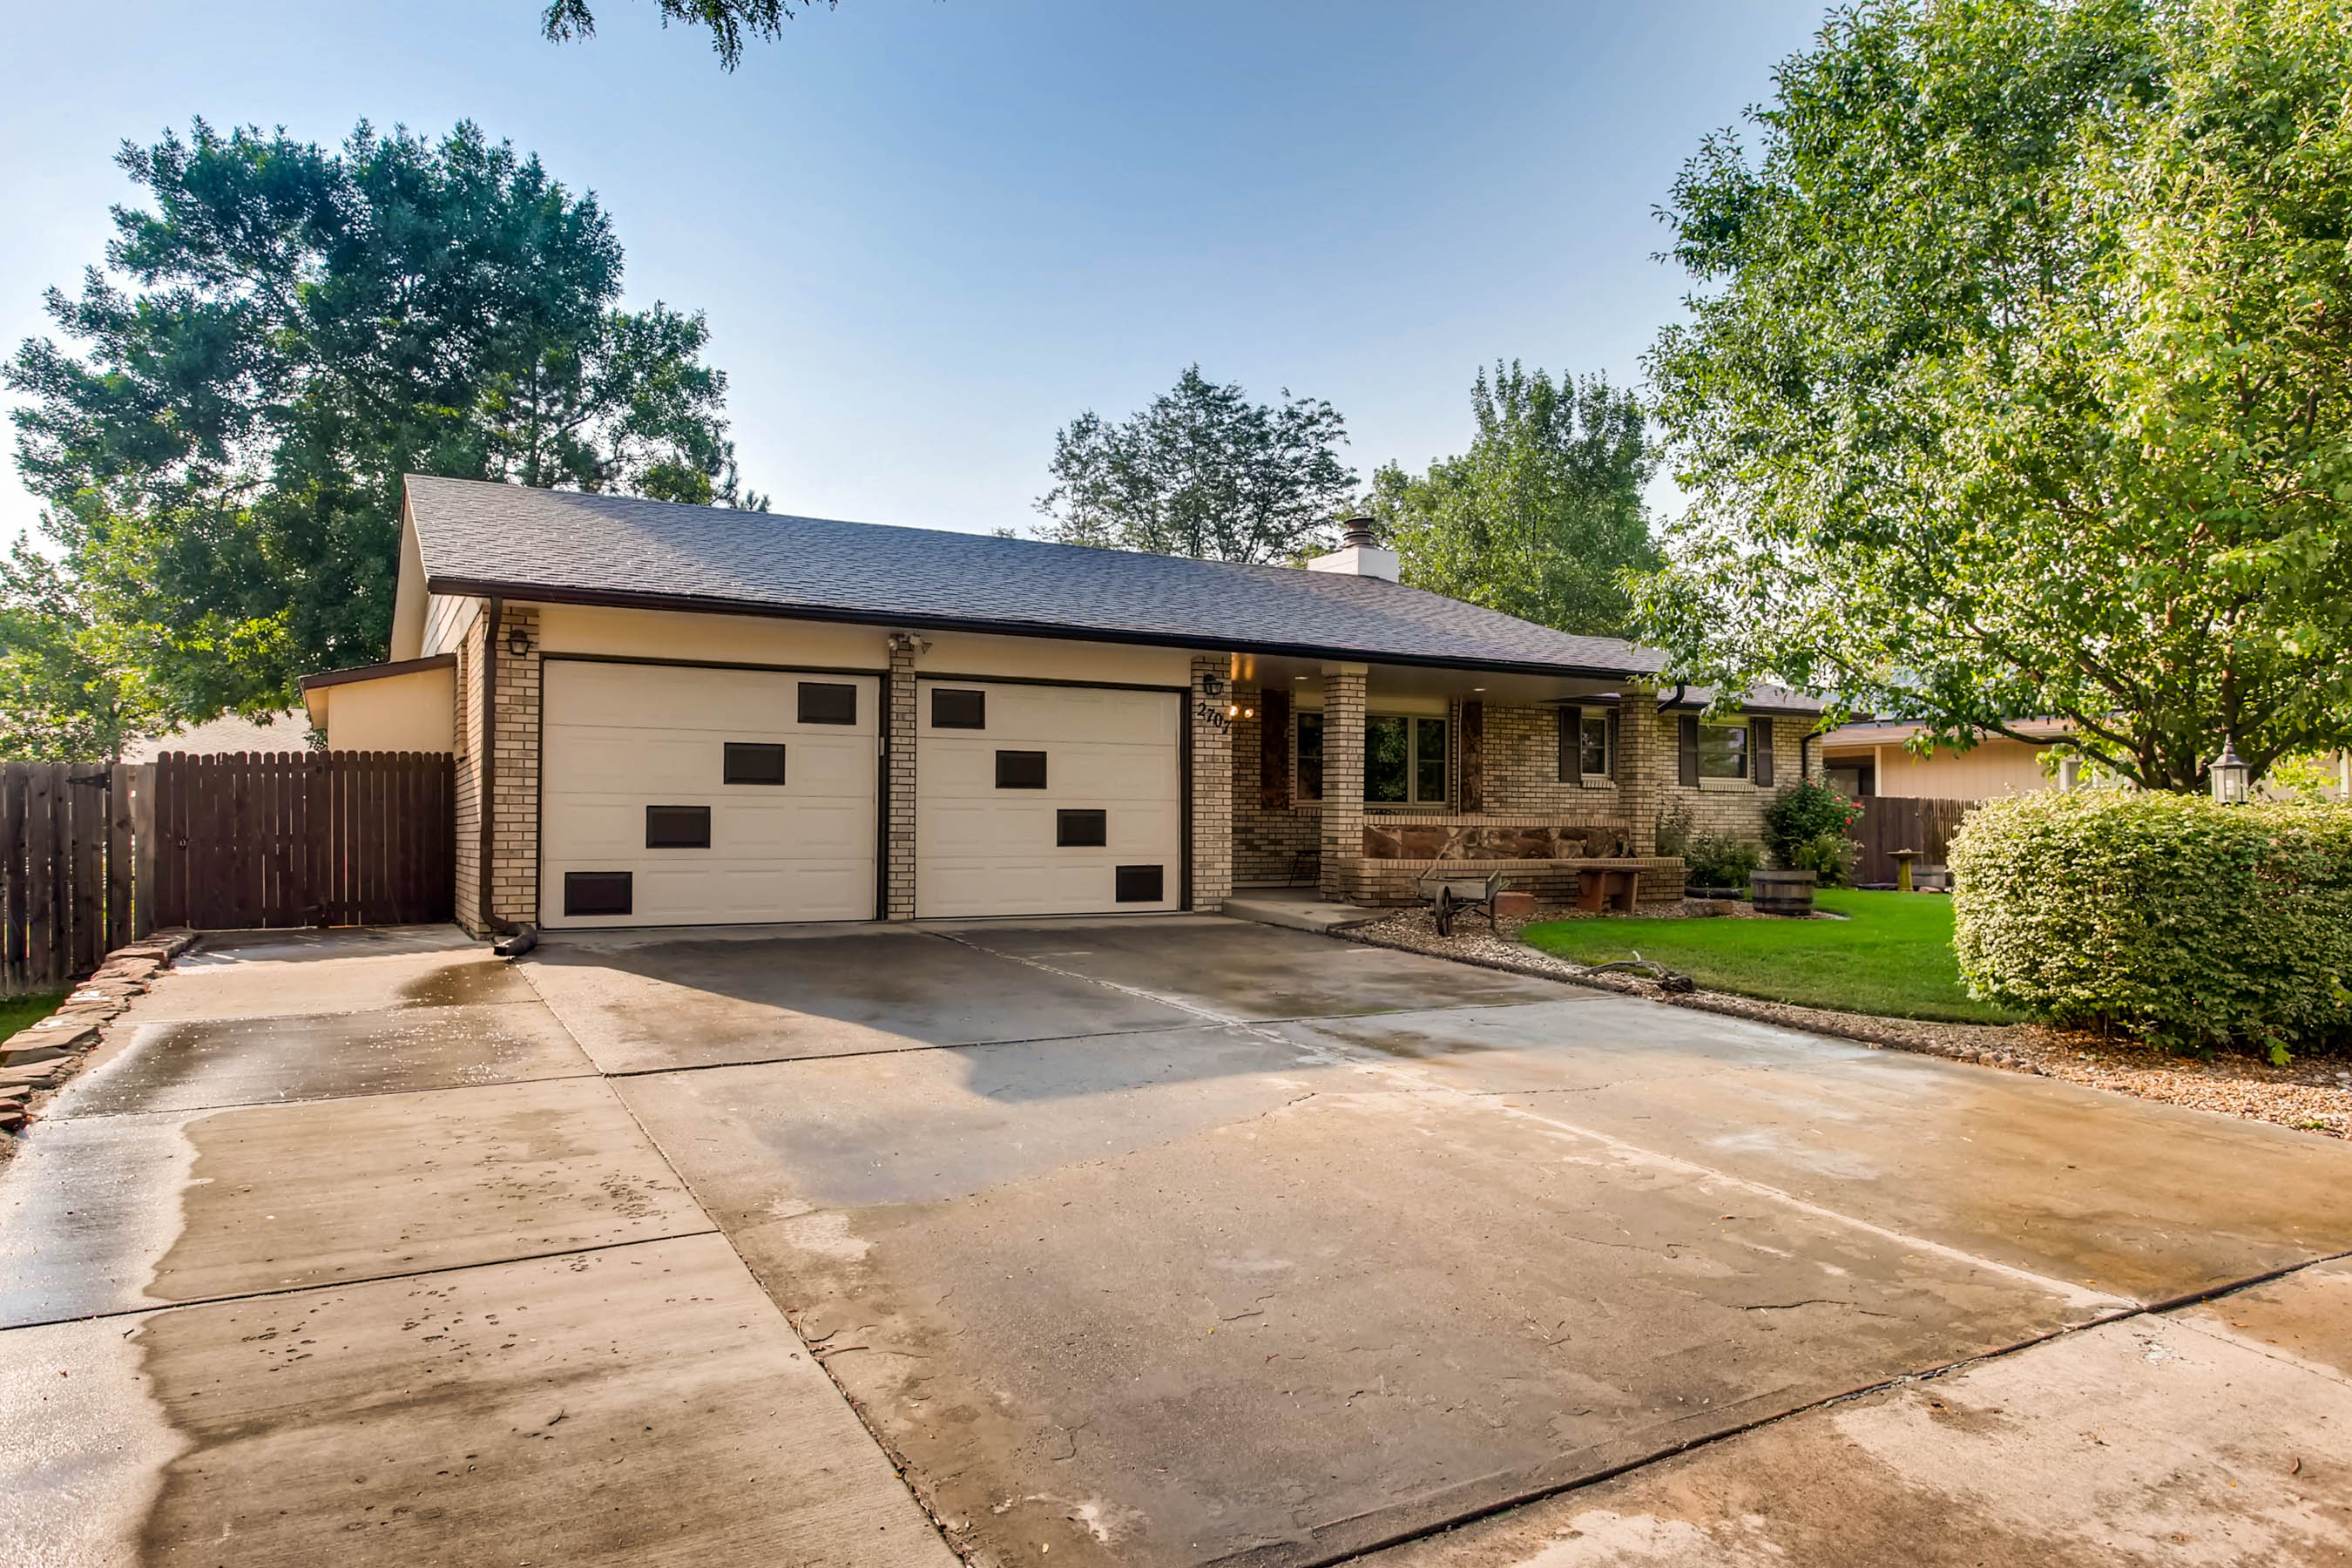
Lovely Brick Ranch Style Home in Loveland!

This home at 2707 Greenland Dr boasts 5 bedrooms, 3 bathrooms, finished basement and a 2 car garage. Enjoy your morning coffee in the relaxing sun-room just off of the kitchen. In the winter, retreat to the basement to unwind in front of the wood burning fireplace. The backyard is fully fenced with an additional shed to store all of the lawn maintenance equipment. Located close to Lake Loveland and the Benson Sculpture Park. Call for your private showing at 970-401-0123 for more information or click the link below for more details.

https://rondidupont.com/listing/82739865

Fort Collins RealtorGardner ReportNorthern Colorado Real Estate July 31, 2018

2nd Quarter Gardner Report

The following analysis of the Metro Denver & Northern Colorado real estate market (which now includes Clear Creek, Gilpin, and Park Counties) is provided by Windermere Real Estate Chief Economist Matthew Gardner. We hope that this information may assist you with making better-informed real estate decisions. For further information about the housing market in your area, please don’t hesitate to contact your Windermere agent.


ECONOMIC OVERVIEW

Colorado continues to see very strong job growth, adding 72,800 non-agricultural jobs over the past 12 months—an impressive increase of 2.7%. Through the first five months of 2018, the state added an average of 7,300 new jobs per month. I expect this growth to continue through the remainder of the year, resulting in about 80,000 new jobs in 2018.

In May, the state unemployment rate was 2.8%. This is slightly above the 2.6% we saw a year ago but still represents a remarkably low level. Unemployment remains either stable or is dropping in all the markets contained in this report, with the lowest reported rates in Fort Collins and Boulder, where just 2.2% of the labor force was actively looking for work. The highest unemployment rate was in Grand Junction, which came in at 3.1%.


HOME SALES ACTIVITY

  • In the second quarter of 2018, 17,769 homes sold—a drop of 2.4% compared to the second quarter of 2017.
  • Sales rose in 5 of the 11 counties contained in this report, with Gilpin County sales rising by an impressive 10.7% compared to second quarter of last year. There were also noticeable increases in Clear Creek and Weld Counties. Sales fell the most in Park County but, as this is a relatively small area, I see no great cause for concern at this time.
  • Slowing sales activity is to be expected given the low levels of available homes for sale in many of the counties contained in this report. That said, we did see some significant increases in listing activity in Denver and Larimer Counties. This should translate into increasing sales through the summer months.
  • The takeaway here is that sales growth is being hobbled by a general lack of homes for sale, and due to a drop in housing demand.


HOME PRICES

  • With strong economic growth and a persistent lack of inventory, prices continue to trend higher. The average home price in the region rose
    9.8% year-over-year to $479,943.
  • The smallest price gains in the region were in Park County, though the increase there was still a respectable 7%.
  • Appreciation was strongest in Clear Creek and Gilpin Counties, where prices rose by 28.9% and 26%, respectively. All other counties in this report saw gains above the long-term average.
  • Although there was some growth in listings, the ongoing imbalance between supply and demand persists, driving home prices higher.


DAYS ON MARKET

  • The average number of days it took to sell a home remained at the same level as a year ago.
  • The length of time it took to sell a home dropped in most markets contained in this report. Gilpin County saw a very significant jump in days on market, but this can be attributed to the fact that it is a very small area which makes it prone to severe swings.
  • In the second quarter of 2018, it took an average of 24 days to sell a home. Of note is Adams County, where it took an average of only 10 days to sell a home.
  • Housing demand remains very strong and all the markets in this report continue to be in dire need of additional inventory to satisfy demand.


CONCLUSIONS

This speedometer reflects the state of the region’s real estate market using housing inventory, price gains, home sales, interest rates, and larger economic factors.

For the second quarter of 2018, I have moved the needle very slightly towards buyers as a few counties actually saw inventories rise. However, while I expect to see listings increase in the coming months, for now, the housing market continues to heavily favor sellers.


Matthew Gardner is the Chief Economist for Windermere Real Estate, specializing in residential market analysis, commercial/industrial market analysis, financial analysis, and land use and regional economics. He is the former Principal of Gardner Economics, and has more than 30 years of professional experience both in the U.S. and U.K.

Northern Colorado Real EstateVirtual Tours July 26, 2018

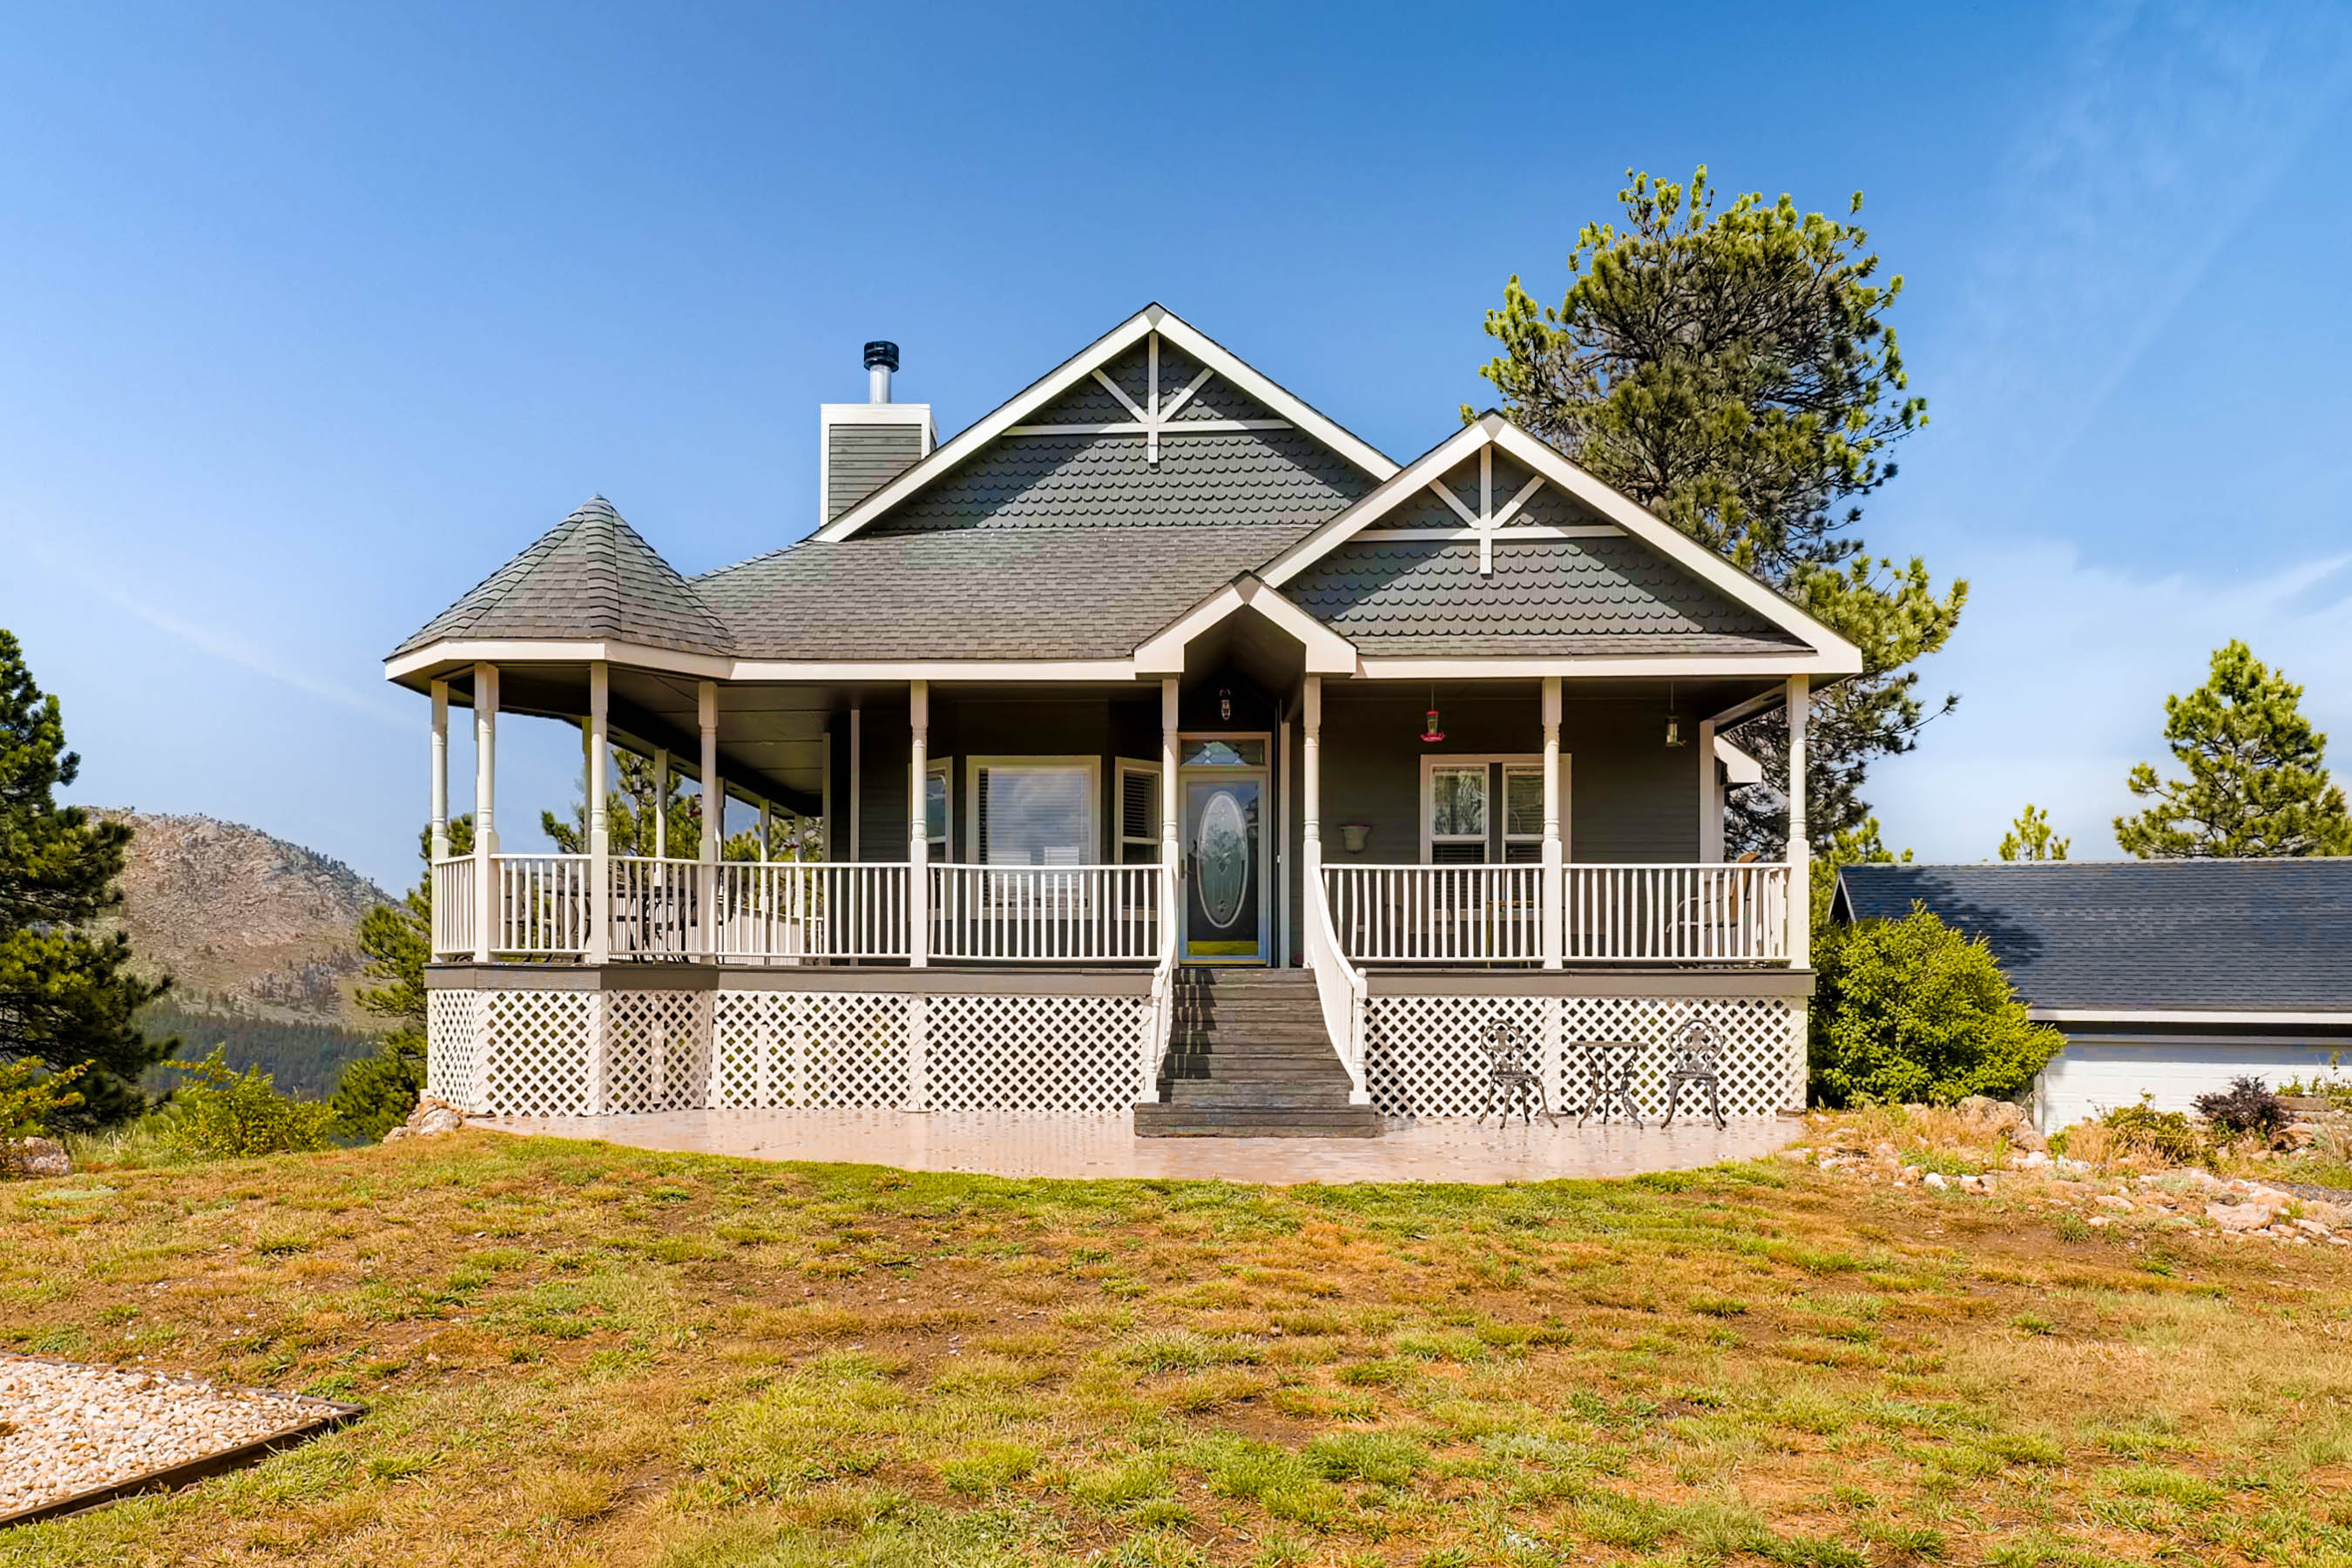
Victorian Style Mountain Home in Drake!

This 2 bedroom, 2 bathroom home at 1486 Palisade Mountain Dr has stunning views of Mt Meeker, Long’s Peak & Storm Mountain from the wrap around covered deck. Featuring 3 fireplaces, stainless steel appliances, claw foot soaking tub, & a lower level family room with a walkout to the spectacular 2 acre property. Matching the exterior of the home are 2 outbuildings with a total of 5 car garage space & a studio, with the addition of a bath could be used as a rental or guest house. Don’t miss this one of a kind home! Call for your private showing at 970-401-0123 for more information or click the link below for more details.

https://rondidupont.com/listing/82133893