BlogFun Facts December 1, 2023

Most Surprising News

The most surprising piece of news for our friends and clients is that prices are essentially flat compared to last year.  People find that surprising given what interest rates have done over the last 18 months.  They wonder, how could prices not fall significantly after interest rates jumped considerably?

The answer is the fundamental economic lesson of supply and demand.

There is enough demand in the market for the current supply to keep prices stable even in an environment of higher rates.

Now that rates are (finally) trending down, it gives us even more confidence about the continued growth of real estate prices along the Front Range.

Here is a look at how home prices compare to one year ago:

Larimer County = Down 0.8%

Weld County = Up 3.4%

Metro Denver = Up 0.8%

BlogFun Facts June 30, 2023

How Would Have Guessed?

Pretend it is 2013. The real estate market is clearly recovering from the Great Recession. The Broncos are having a great year and will eventually make it to the Super Bowl.

Now, imagine someone makes a prediction that 10 years in the future mortgage interest rates would double over the course of 12 months.

If you were to guess what sort of impact on house prices that would cause, what would you say?

It would be reasonable to guess that prices would decline if mortgage rates doubled.

Here’s what really happened. Prices kept going up.

Some thought prices would crash. Many thought prices would go down.

They keep going up. Not as fast as they were, but they are still up.

Compared to one year ago, prices are up the following amounts:

Larimer County = 2.6%

Weld County = 2.2%

Metro Denver = 1.1%

Why? Supply and demand.

Supply is low and there is still demand in the market.

BlogFor Buyers & SellersFun Facts September 16, 2022

Peak Price

Here is a peek at average residential prices along the Front Range through the first half of September and how they have changed versus one year ago:

  • Larimer County = $663,000 up 11.6%
  • Weld County = $511,000 up 4.5%
  • Boulder County = $1,165,000 up 17%
  • Metro Denver = $668,000 up 9%
BlogFun Facts June 3, 2022

Timber!

A positive outcome of the cooling housing market is lower lumber prices.

Lumber is now priced at $605 per thousand board feet.  This is a new low for 2022.

Prices for lumber are now down 47% for the year and are well below the 2021 peak of $1,733 per thousand board feet.

What’s causing this?  Higher mortgage rates have slowed the pace of new home sales and remodeling projects.

Most experts believe that lumber prices will fall even further during the remainder of the year.

Blog March 11, 2022

3.2 Trillion

The new CoreLogic Homeowner Equity Insights report shows that homeowners in the U.S. have seen their equity increase by a total of $3.2 trillion over the last 12 months.

Their data shows that 63% of all homes have a mortgage.

On average, U.S. homeowners gained $55,000 while the average increase in Colorado was higher at $75,000.

The other piece of good news from the report is that properties with negative equity reached the lowest amount in several years.

Only 2.1% of all properties across the U.S. have a value lower than the mortgaged amount.  Negative equity peaked at 26% of all mortgaged properties back in 2009.

BlogFun FactsHomeowners December 10, 2021

Equity Snapshot

CoreLogic just released their quarterly Home Equity Insights Report.

Their analysis shows U.S. homeowners with mortgages (roughly 63% of all properties) have seen their equity increase by a total of over $3.2 trillion since the third quarter of 2020, an increase of 31.1% year over year.

In the third quarter of 2021, the total number of mortgaged residential properties with negative equity decreased by 5.7% from the second quarter of 2021 to 1.2 million homes, or 2.1% of all mortgaged properties.

Negative equity means a home is worth less than the amount owed on the property.

In Colorado, the percentage of homes with negative equity is even lower than the National average at 1.5%.

BlogFun Facts October 15, 2021

In Perspective

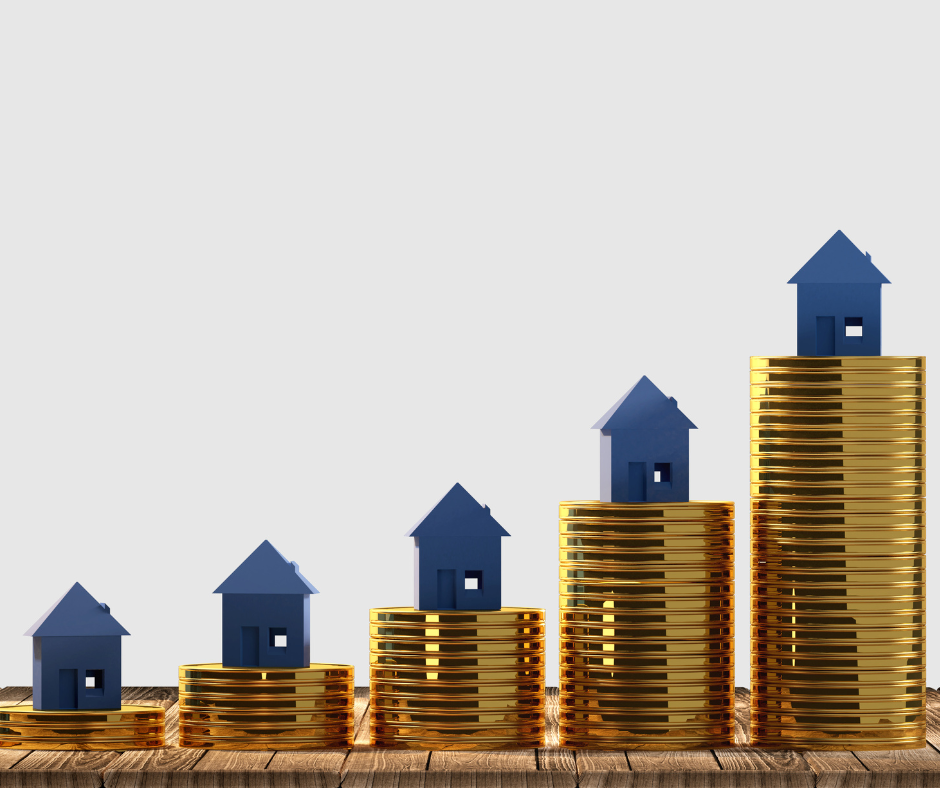
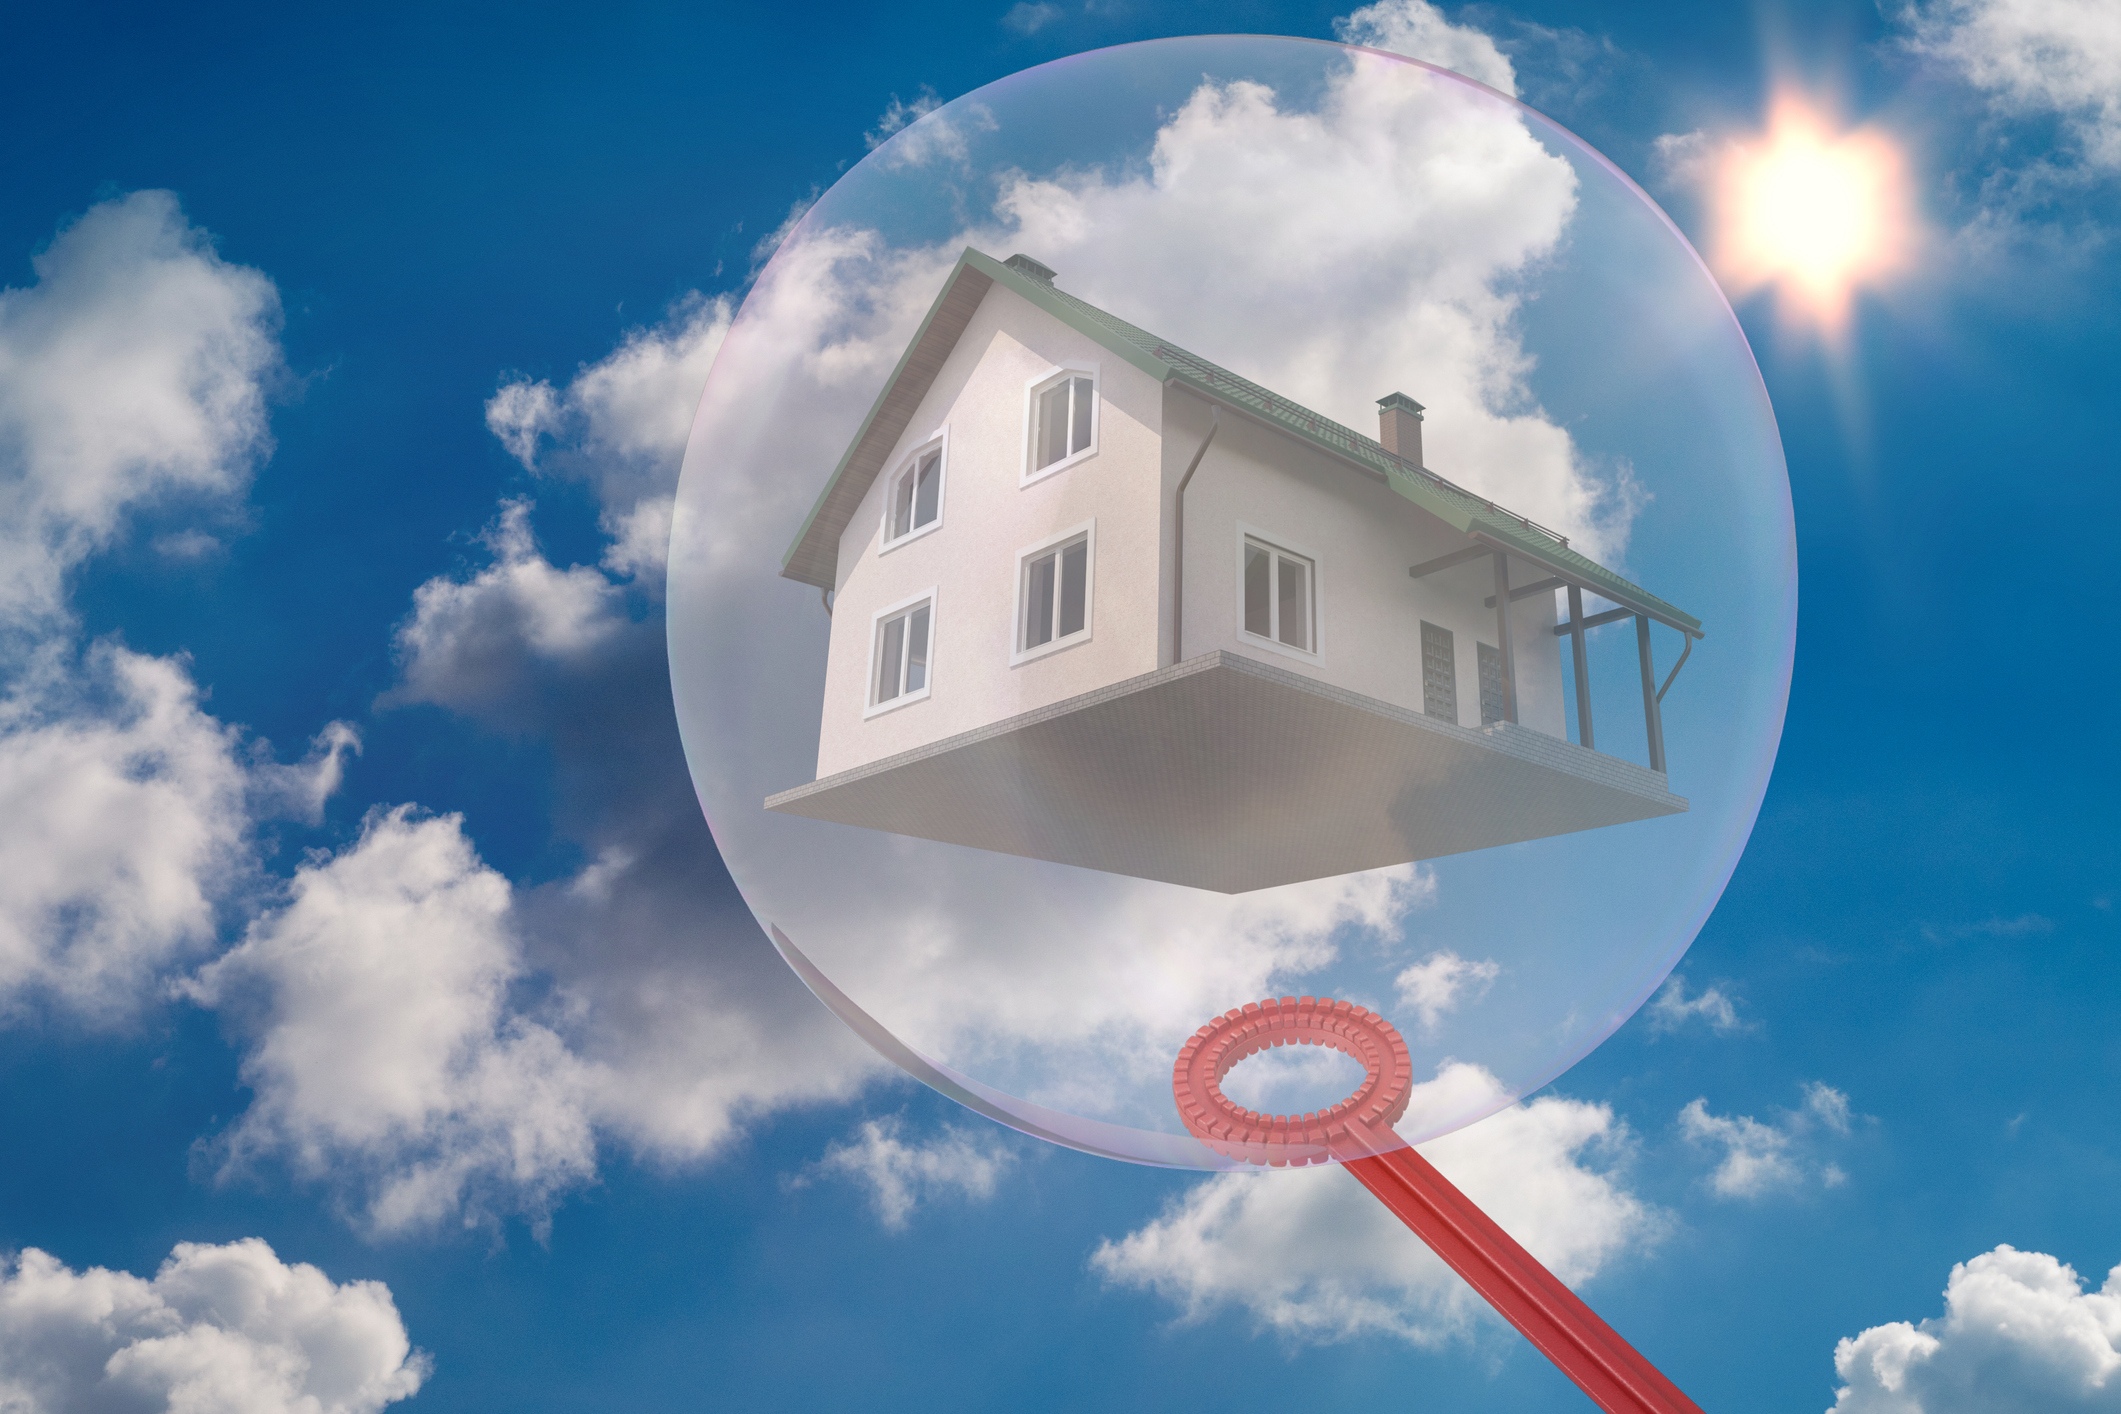
Let’s put today’s home prices in perspective.

Appreciation has been significant over the last 18 months. Some people are wondering if it can last and if there might be a housing bubble.

There are two ways to look at prices. One way is in absolute terms. This is simply looking at the dollar amount a home would sell for at some point in the past versus the dollar amount it would sell for.

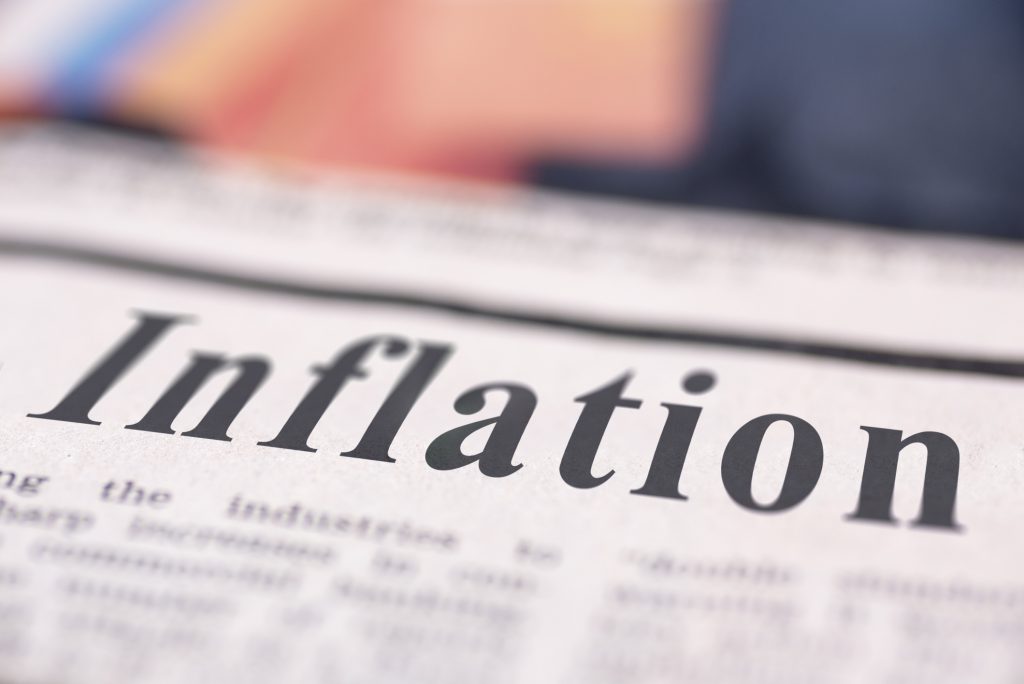
The other way is in real terms. ‘Real’ is an economics term which means that inflation is factored into the valuation.

For example, a gallon of milk costs more today in absolute terms than it did 15 years ago. However, in real terms, the cost is about the same as 15 years ago because inflation is factored in. The price of milk has essentially escalated at the same rate as inflation.

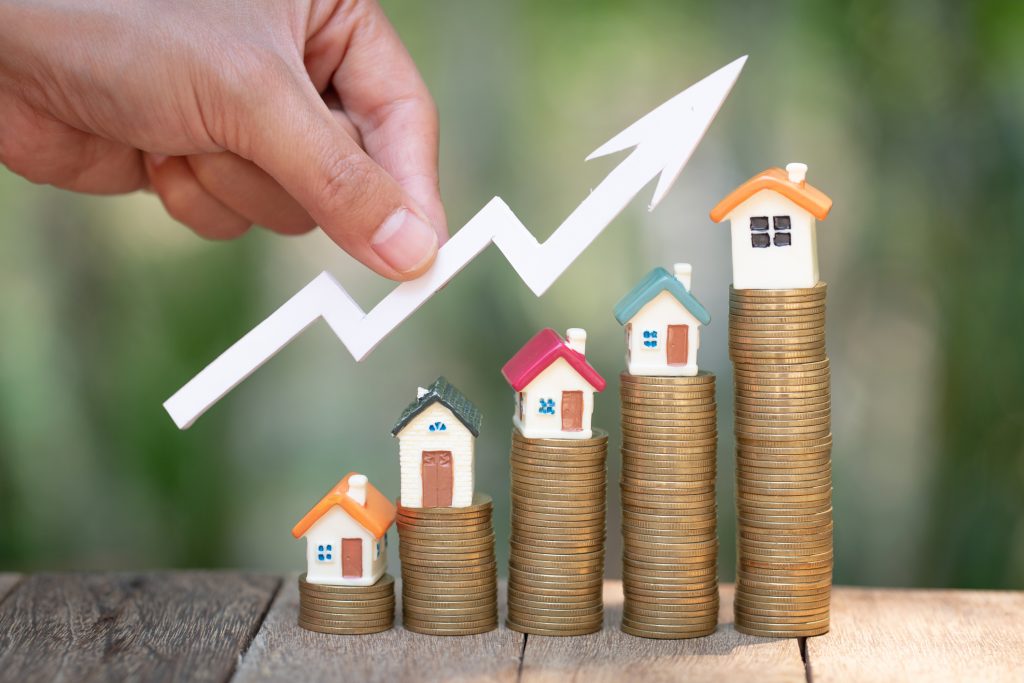
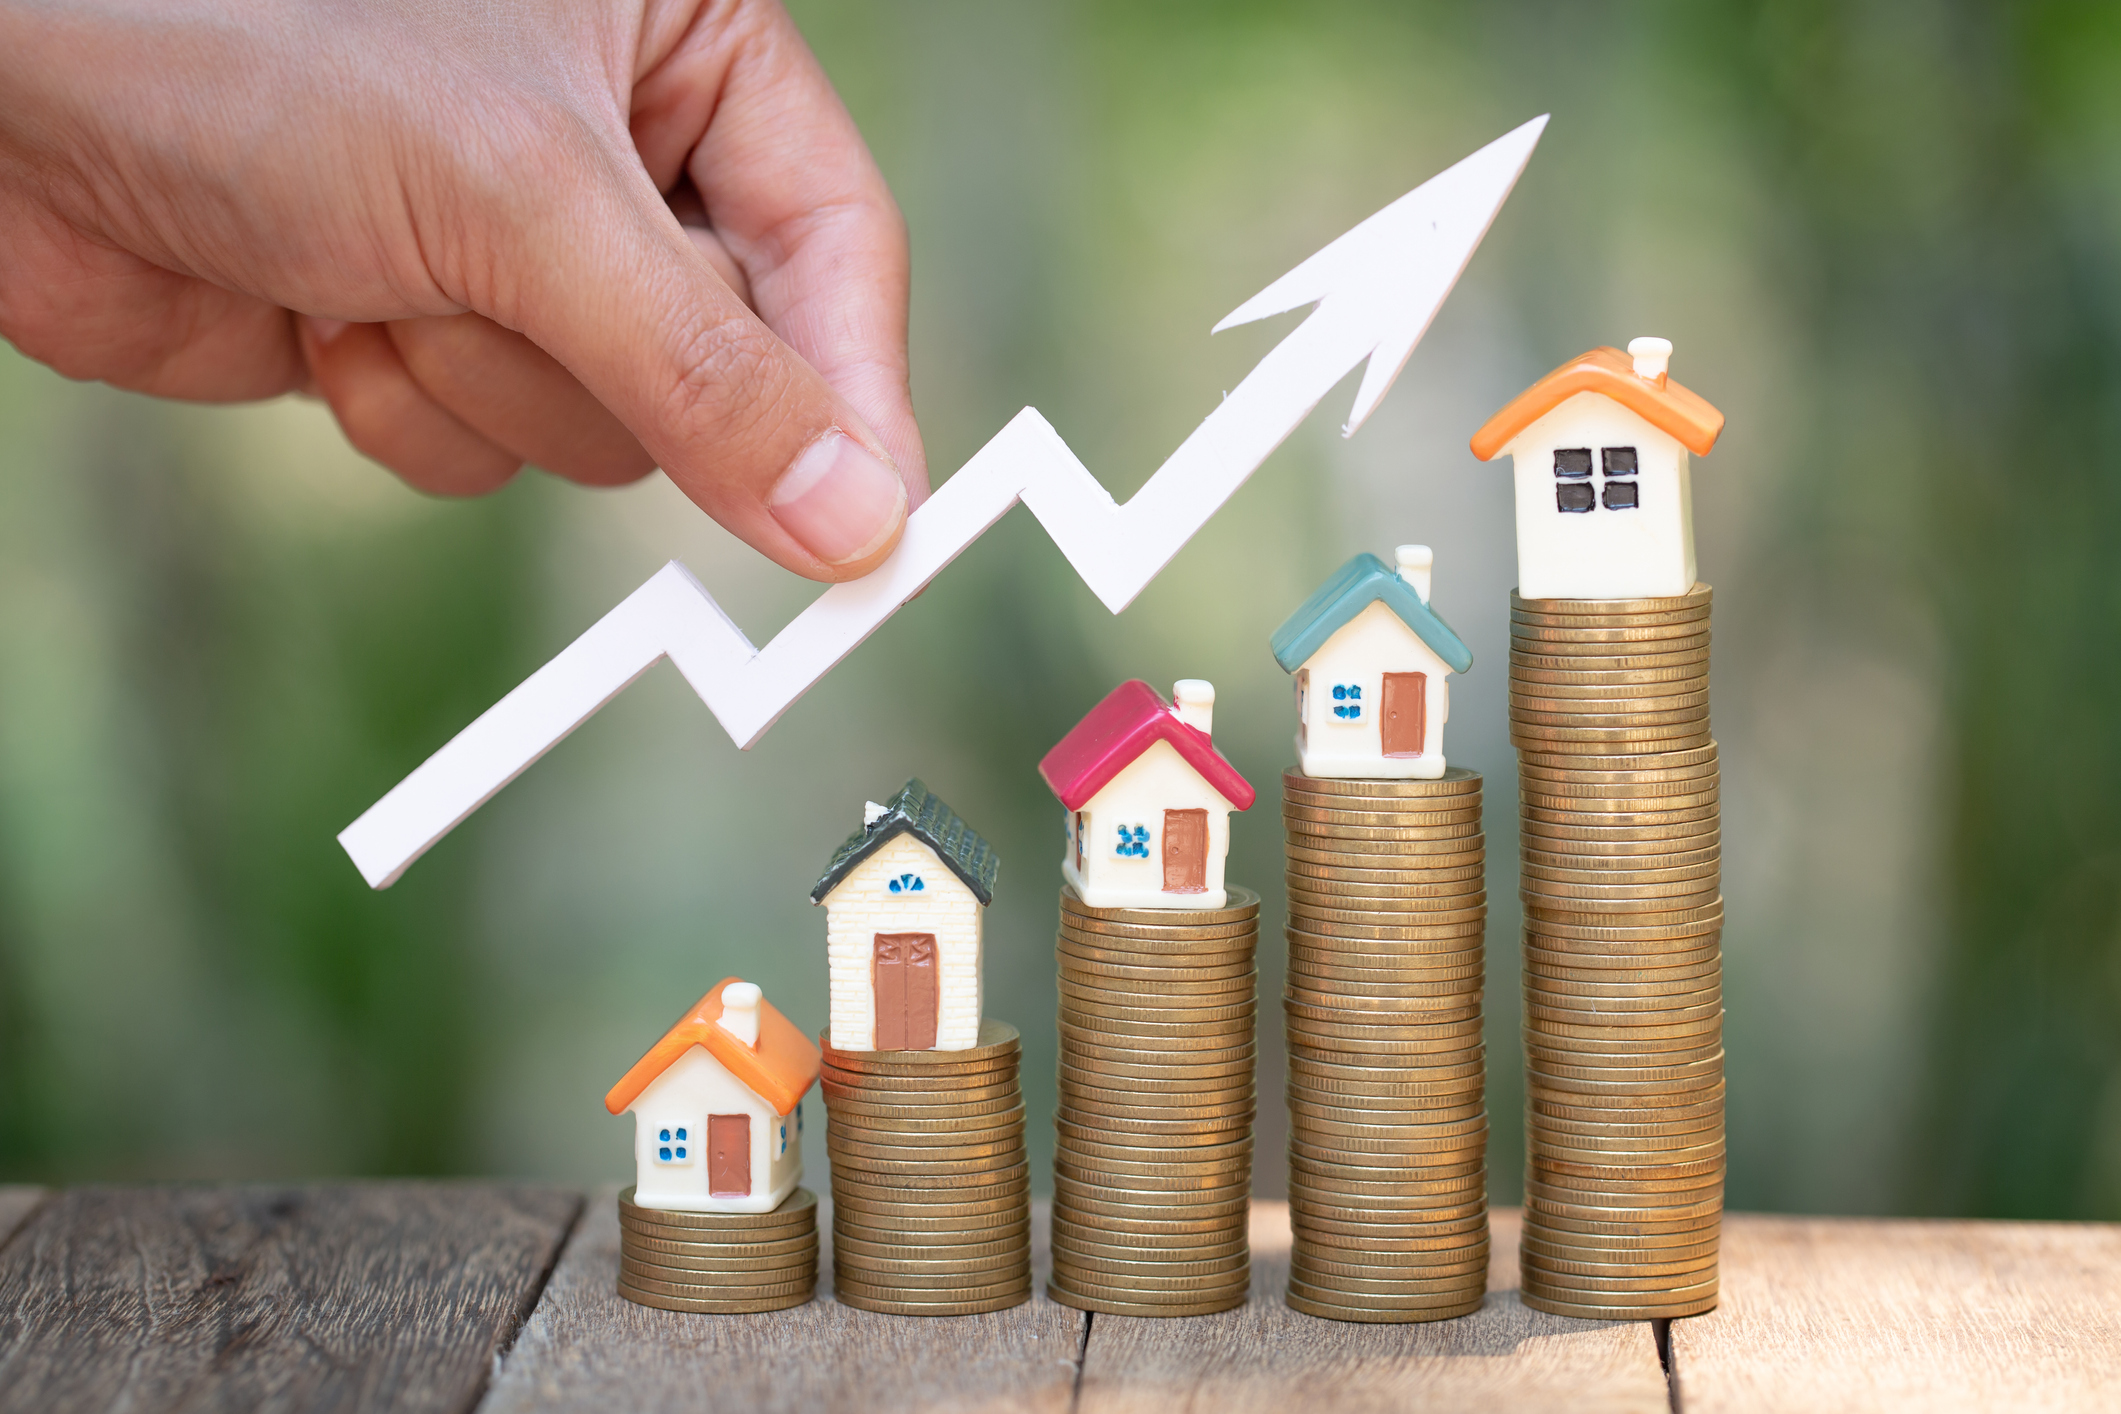
So, how about home prices? As we know, prices in absolute terms are higher than 15 years ago. To be exact, prices are 43% higher Nationally compared to 2006 according to Case-Shiller.

However, in real terms, prices are the same as 2006.

Over the last 15 years, homes have appreciated at essentially the same rate as inflation.

BlogFun Facts June 14, 2021

Colorado Ranking

Here’s the latest from one of our favorite data sources – the Federal Housing Finance Authority (FHFA).

They track home prices across the Country and produce a quarterly Home Price Index report.

It is not uncommon to find Colorado near the top of the list for year over year price growth.

The latest report has us ranked 13th with only a 13% year over year increase (said with sarcasm).

Idaho is first with a whopping 24% increase. Utah is second at 19%.

Here is our interpretation of these numbers…

Colorado has a history of strong, steady price growth instead of booms and busts.

Our market does not take the big, wild swings in prices that other markets sometimes do.

The fact that Colorado is not at the very top of the list right now is actually good news to us.

We know that our clients appreciate a market that is more steady instead of one that can feel like a rollercoaster.

For Buyers & SellersFun FactsMarket News October 9, 2020

Re Bubble

Bubble

The activity in the Front Range market is causing us to hear the bubble question again.

People are curious to know, based on recent growth in price appreciation, if we are in a housing bubble.

This question seems to crop up when prices go up.

While we do not believe that the current double-digit price appreciation is sustainable, we firmly believe we will not see prices crash or see any kind of a bubble bursting.

Here’s why we think that…

This past Tuesday we hosted a private online event for our clients which featured our Chief Economist Matthew Gardner.

Matthew is well-known and well-respected in the industry.  He is often quoted in leading real estate publications.

He sees four reasons why there is no real estate bubble that is about to pop in Colorado.

  1. Inventory is (incredibly) low.  The number of homes for sale is down over 40% compared to last year.  The market is drastically under-supplied.  Based on simple economic principles of supply and demand, inventory would need to grow significantly for prices to drop.
  2. Buyers’ credit scores are very high.  The average credit score for buyers last month, for example was 759.  So, by definition, average buyers today have excellent credit which means there is low risk of them walking away from their mortgage and causing a foreclosure crisis.
  3. Buyers have high down payments.  On average, buyers are putting 18% down on their purchases.  This means that prices would need to fall by a considerable amount in order for the average buyer to be ‘upside down’ on their mortgage.
  4. Owners are equity rich.  Well over a third of property owners along the Front Range have more than 50% equity in their homes.  This means that a severe economic downturn causing a slew of distressed properties to hit the market is highly unlikely.

Bottom line, as Matthew Gardner reminded us, what we are experiencing in the economy today is a health crisis not a housing crisis.

If you would like a recording of the private webinar I would be happy to send it to you.  Just reach out and let me know.

BlogFort Collins Real EstateFort Collins RealtorFun Facts September 1, 2017

Colorado Home Price Appreciation

New Rankings

The new rankings are out from the Federal Housing Finance Authority which ranks all 50 states plus close to 300 individual metropolitan markets for home price appreciation.

We trust this source because they track actual sales of individual homes versus simply looking at average prices. Their home price index is one of the key pieces of research that we follow closely.

There are a few significant items in their latest report (which is hot off the press).

  • Colorado is ranked 2nd for one-year appreciation, 5th for five-year appreciation and 1st for twenty five-year appreciation. Prices across Colorado have increased 324% since the end of 1991.
  • Fort Collins/Loveland is ranked 10th out of all the metro areas for one-year appreciation with a 12.1% increase.
  • Greeley is in at 21st with 10.73% appreciation

In case you are curious, the hottest market in the country is Mount Vernon, Washington with 15.1% yearly appreciation. Atlantic City is ranked last with a 0.8% price decrease.

It’s clearly “good to be us” as we are one of the highest-performing markets over the long-haul.

Check out the FHFA recap video here:

Here is the data straight from FHFA’s report:

U.S. house prices rose 1.6 percent in the second quarter of 2017 according to the Federal Housing Finance Agency (FHFA) House Price Index (HPI).   House prices rose 6.6 percent from the second quarter of 2016 to the second quarter of 2017.  FHFA’s seasonally adjusted monthly index for June was up 0.1 percent from May.

The HPI is calculated using home sales price information from mortgages sold to, or guaranteed by, Fannie Mae and Freddie Mac.  FHFA has produced a video of highlights for this quarter.

Significant Findings

  • Home prices rose in 48 states and the District of Columbia between the second quarter of 2016 and the second quarter of 2017.  The top five states in annual appreciation were:  1) Washington 12.4 percent; 2) Colorado 10.4 percent; 3) Idaho 10.3 percent; 4) Florida 9.4 percent; and 5) Utah 9.2 percent.
  • Among the 100 largest metropolitan areas in the U.S., annual price increases were greatest in the Seattle-Bellevue-Everett, WA (MSAD), where prices increased by 15.7 percent.  Prices were weakest in New Haven-Milford, CT, where they rose by 0.1 percent.
  • Of the nine census divisions, the Pacific division experienced the strongest increase in the second quarter, posting a 2.6 percent quarterly increase and a 8.9 percent increase since the second quarter of last year.  House price appreciation was weakest in the Middle Atlantic division, where prices rose 0.8 percent from the last quarter.

Source: FHFA